GetCoattail Research — The Filing Tape #160. Newmont reports third-quarter 2026 results after the close on October 22, 2026 — one of the day's earnings-focus names. The June filings show just 5 tracked holders, every one of them cutting or standing still in a quarter when the price fell 13.7%, and an insider record with no purchase in it.
The Hype
The attention is an earnings evening. Newmont is on the October 22 earnings-focus list, reporting after the close. WEEX TradFi Daily, October 22, 2026 WEEX puts the consensus at about $1.94 a share, with gold production, all-in sustaining costs and cash flow as the questions, and gold itself trading near $4,115. A TickerOn preview puts the adjusted consensus range at $1.96 to $2.18 a share on revenue near $6.0–6.2 billion, against $1.71 and $5.52 billion a year earlier, and points to full-year guidance of roughly 5.26 million ounces at an all-in sustaining cost of $1,680 an ounce. TickerOn, October 2026 Seeking Alpha's preview prints $1.94, up 13.5% year over year, on revenue of $6.26 billion, up 13.4%. Seeking Alpha, October 21, 2026 Our price file, which ends October 2, shows a stock that fell into the summer and ran into this print: down 13.7% in Q2 ($108.25 on March 31 to $93.40 on June 30), then up 23.7% to $115.56 at October 2 — still 14.5% below the 252-day high close of $135.14 on August 25, 2026, and up 37.1% from the year-ago September 30 close.
The Tape
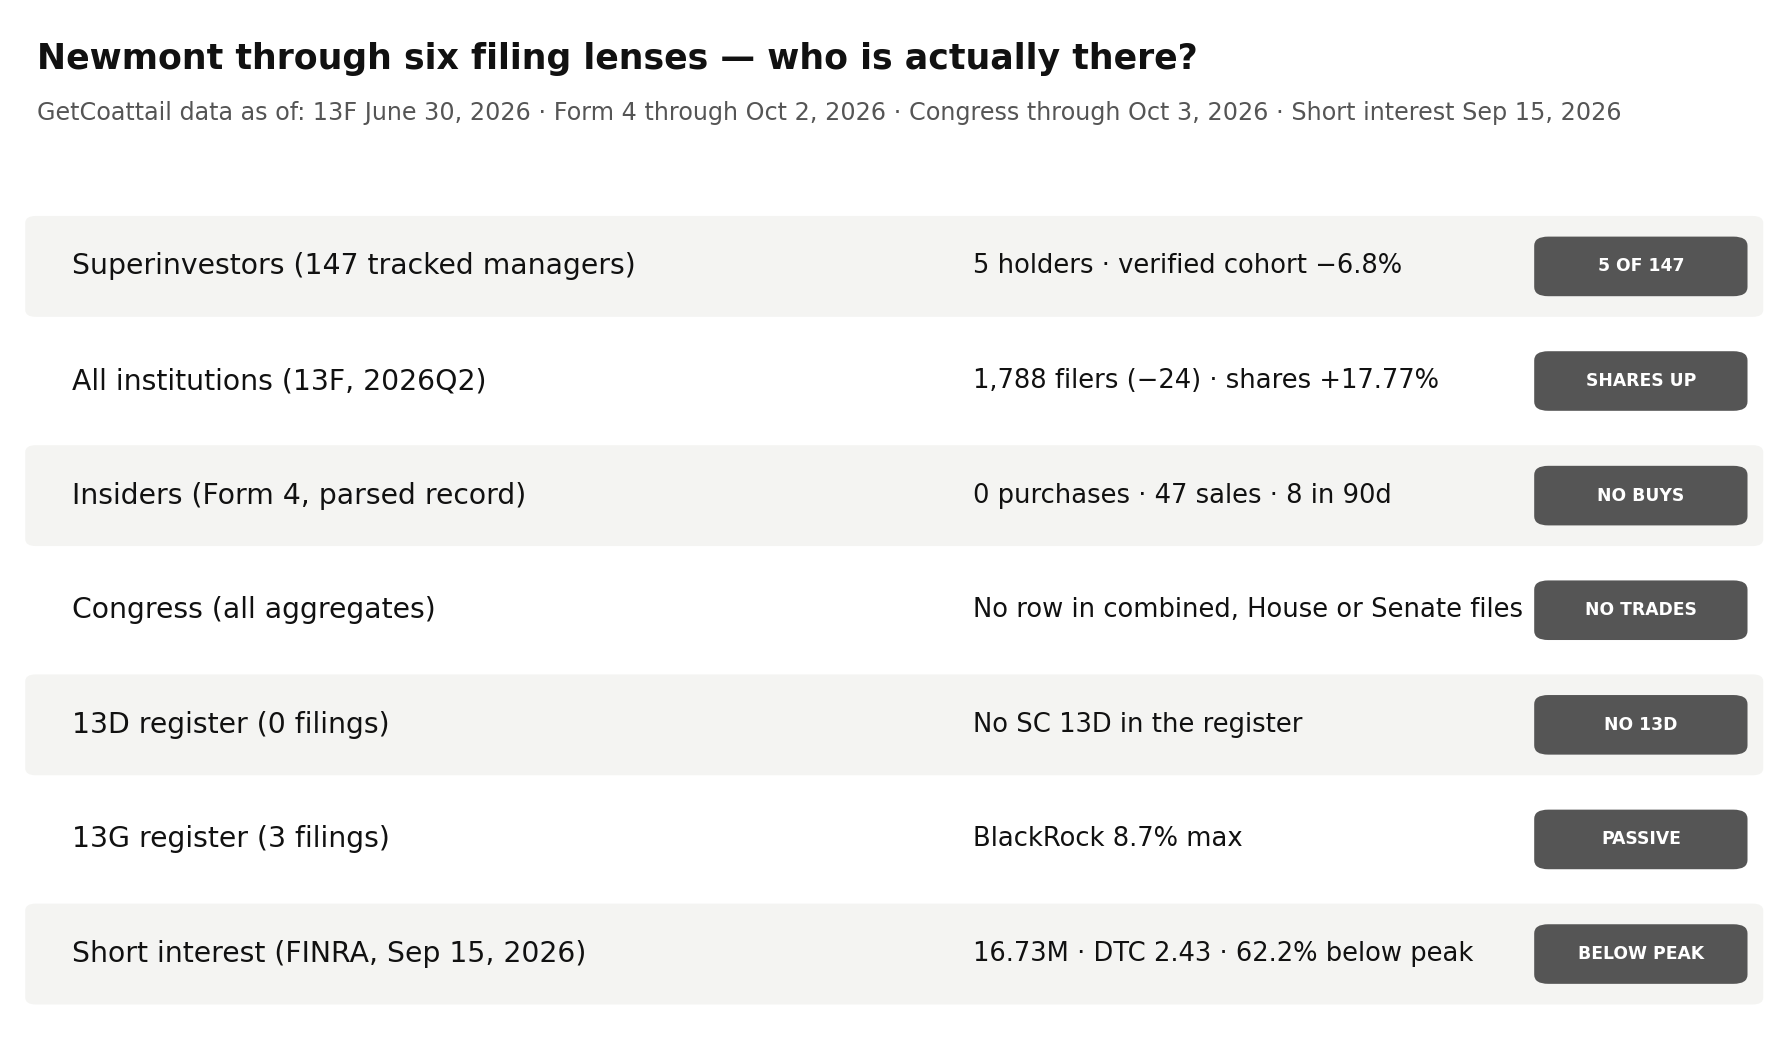
For Newmont, the one hundred and sixtieth Filing Tape audit, the tape shows 5 tracked managers — every June holder cutting or standing still, the verified cohort down 6.8% — a full market that added 122,424,866 shares while its filer count fell, an insider record with no purchase and 47 sales, no congressional trades at all, a 5% register topped by an 8.7% passive print, and a borrow of 1.59% that sits 62.2% below its 2023 maximum.
| Lens | As of | What the filings show | Direction vs prior period |
|---|---|---|---|
| Superinvestors (13F) | Jun 30, 2026 | 5 holders of 147 tracked managers hold 12,762,394 shares; 0 NEW labels | Verified continuing holders −6.8% (13,700,732 → 12,762,394 shares); register total −6.9% |
| All institutions (13F) | Jun 30, 2026 | 1,788 filers; 811,547,980 shares; reported value $77,471,778,796 | Filers −24; shares +17.77%; reported value +7.92% |
| Insiders (Form 4) | Oct 2, 2026 | Last 90 days (by filing date): 0 purchases, 8 sales; parsed record: 0 purchases, 47 sales | No purchase in the parsed record: 0 across 124 filings |
| Congress | Oct 3, 2026 | No row in the combined, House or Senate aggregates; no member-file rows | No recorded trades in any congressional file |
| 13D/G | Apr 29, 2026 | 3 parsed filings, all SC 13G family (0 SC 13D); register maximum 8.7% | Latest filing, Apr 29, 2026, prints Vanguard Capital Management at 7.7% as of Mar 31, 2026 |
| Short interest (FINRA) | Sep 15, 2026 | 16,728,543 shares; 2.43 days to cover; 1.59% of the share count | Down 62.2% from the Oct 31, 2023 series maximum; down 27.4% from a year ago |
Lens 1 — the superinvestors: 5 holders, and not one of them added. The collection holds 147 managers (144 at June 30; 3 early filers at September 30). The June 30, 2026 common-stock register is 5 distinct managers holding 12,762,394 shares worth $1,194,195,549, long only, with no option rows. First Eagle Investment Management holds 11,570,326 shares, 90.7% of the cohort, at a 1.78% weight, labelled DECREASED at −3.8%; the second holder, DJE Kapital, holds 508,750 shares, 4.0% — the top two together are 94.6% of the cohort. The direction across all 5 is 4 decreased and 1 unchanged, with no increase and no new position: DJE Kapital cut 47.2%, Semper Augustus cut 6.7%, Muhlenkamp was flat at −0.0%, and Mairs & Power held 5,000 shares unchanged. Every continuing label verifies under both pairing methods: the 5 continuing holders held 13,700,732 shares at March 31 and 12,762,394 at June 30, a verified change of −6.8%, in a quarter when the price itself fell 13.7%. One of the three September early filers holds the name: Sarasin & Partners, 25,700 shares at September 30, labelled INCREASED at +53.9% against its verified June register row of 16,700 shares — the only increase anywhere in this lens, and it is dated September, not June. One tracked name exited: Atalanta Sosnoff Capital, 3,850 shares at March 31, gone by June. Four of the five June holders imply the $93.40 June 30 close exactly; DJE Kapital implies $97.70, so the cohort aggregate implies $93.57, 0.18% above the close (methodology). At 1.57% of reported institutional shares the cohort is a sample, not the register. 13F figures are as of June 30, 2026, published up to 45 days later.
Lens 2 — institutions: 24 fewer filers, 122.4 million more shares. At June 30, 2026, 1,788 institutions reported positions on the name's single common-stock CUSIP, down 24 from 1,812 at March 31 (−1.32%); 1,780 are long. Reported shares rose 17.77% to 811,547,980 (+122,424,866 shares), while reported value rose 7.92% to $77,471,778,796, labelled "reported" because the aggregate includes option rows (methodology). Flow counts agree (1,419 entered, 1,443 exited, net −24), and the single-CUSIP aggregate matches the by-ticker total on every field. The aggregate implies $95.46 against the $93.40 close (+2.21%). The quarter's price fell 13.7%, so the reported-value rise understates the share accumulation: the share count, which no price move can inflate, rose 17.77% on its own. The tracked cohort moved the other way — verified at −6.8% — so on this name, in this quarter, the broad market accumulated while the tracked managers trimmed.
Lens 3 — insiders: no purchase, 47 sales. The parsed Form 4 record holds 124 filings, from January 14, 2025 through October 2, 2026, inside windows that run through October 2, 2026. The last 90 days (a filing-date window, per the aggregate's own definition) hold 15 filings, no open-market purchase, and 8 sale-coded rows across 38,973 shares worth $4,204,309.47, by 3 sellers, all 8 of them officer rows. The last year holds no purchase either, against 26 sale-coded rows across 122,169 shares worth $13,394,205.38, by 9 sellers, 23 of them officer rows. The full parsed record holds no purchase at all: 0 purchase rows, against 47 sale-coded rows across 197,676 shares worth $17,159,427.48, 35 of them officer rows, by 9 sellers — 21 sale rows, in 55 filings dated before October 3, 2025, sit outside the last year's window. The claim is bounded by the record's span: within this record, which begins in January 2025, the purchase column is blank in every window.
Lens 4 — Congress: no recorded trades. This lens is empty, and the audit says so rather than skipping it. The combined aggregate (as of October 3, 2026), the House aggregate (as of October 3, 2026) and the Senate aggregate (as of October 1, 2026) each carry no row for this ticker, and the House member file (as of October 3, 2026; 2026 House PTR filings, transactions dated on or after April 1, 2026) lists no member with a position in it. There is nothing to total.
Lens 5 — the 5% register: an 8.7% passive maximum, no activist filing. Our full parse holds 3 SC 13D/G filings, all in the SC 13G family (1 SC 13G and 2 SC 13G/A amendments); there is no SC 13D. The 3 filings carry 3 reporter rows from 3 reporters. The register maximum is BlackRock, Inc., 97,593,380 shares and 8.7%, as of March 31, 2025, filed April 17, 2025. The Vanguard Group later prints 0 shares and 0.0% as of March 13, 2026, filed March 26, 2026. The latest filing is Vanguard Capital Management, 83,245,026 shares and 7.7%, as of March 31, 2026, filed April 29, 2026. The prints are reported as printed, without attributing a reason (methodology).
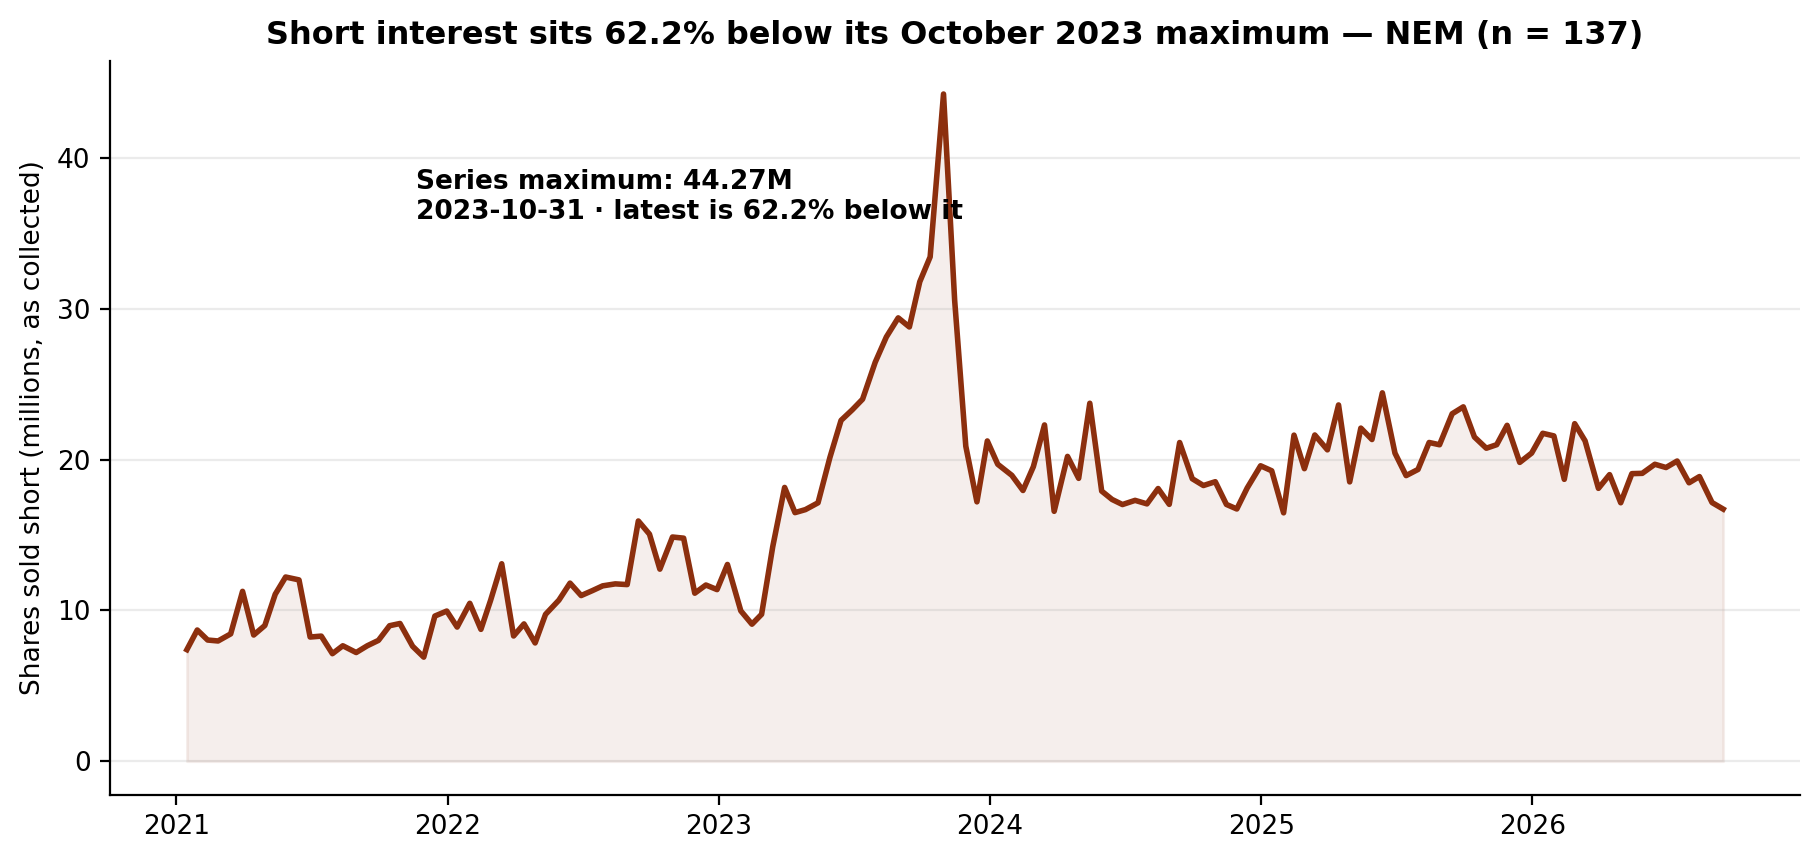
Lens 6 — short interest: 1.59% of shares, down 27.4% in a year, far below its maximum. The latest FINRA settlement, September 15, 2026, records 16,728,543 shares sold short at 2.43 days to cover, 1.59% of the share count in our fundamentals file (a measured count, methodology). The borrow is down 2.53% from the prior settlement, down 14.2% from the June 30, 2026 settlement (19,486,635 shares) and down 27.4% from the year-ago settlement (23,053,364 shares). The series maximum is 44,268,929 shares at October 31, 2023, and the latest reading sits 62.2% below it; the minimum is 6,904,694 shares at November 30, 2021. The summer's path: 19,486,635 (June 30), 19,917,795 (July 15), 18,473,173 (July 31), 18,886,556 (August 14), 17,161,938 (August 31), 16,728,543 (September 15) — six settlements drifting down from a July bump.
The Gap
The narrative arriving tonight is a gold print at a high gold price: a consensus near $1.94 a share, production and all-in sustaining costs to grade, guidance to confirm, and gold itself near $4,115. The June tape underneath points in two directions at once. The full market accumulated — 122,424,866 more shares (+17.77%) in a quarter when the price fell 13.7% — but the tracked cohort did the opposite: all 5 June holders cut or stood still, the verified cohort fell 6.8%, and the register is really one book, First Eagle at 90.7% of it, trimming 3.8%. The only increase in the entire superinvestor lens is a September early filer's 25,700 shares. Insiders contribute one direction only: no purchase anywhere in the parsed record, 47 sales, 8 of them in the last 90 days. Congress contributes nothing at all — no aggregate row, no member row. And the borrow has been draining: 1.59% of the share count, down 27.4% in a year and 62.2% below its 2023 maximum, through a summer in which the price first fell 13.7% and then rebounded 23.7%. One plausible reading is that the October story is carried by the gold price and the earnings setup, while the filing record underneath shows broad institutions buying a falling quarter, tracked managers declining to join them, and neither insiders nor the borrow pressing the other side.
What Would Change the Picture
Nothing above is a recommendation. These filings would change it:
- 1. The 2026Q3 13F season (filing window closing mid-November 2026). The baseline is 5 June common-stock holders with 12,762,394 shares, the continuing cohort verified at −6.8%, First Eagle at 90.7% of the cohort, and one September early filer (Sarasin, 25,700 shares, +53.9% against its June row). Whether First Eagle keeps trimming, whether any June holder increases or a new holder appears, and whether Sarasin's early position grows would change this lens.
- 2. A first insider open-market purchase — the first in the parsed record. The record through the October 2 window end holds 0 purchases against 47 sale-coded rows. A single purchase filed after that date would break a pattern that currently has no exception in the record.
- 3. A first congressional trade in any file. The combined, House and Senate aggregates and the House member file all carry no row for this name. Any recorded purchase or sale, by any member, would change this lens.
- 4. A first SC 13D, or a 13G print above 8.7%. The register holds no activist filing at all; its maximum is the passive 8.7% print dated March 31, 2025. A 13D from any reporter, or a passive print above 8.7%, would change this lens.
- 5. Short interest above 19,917,795 shares, or a new series maximum. Above the July 15, 2026 reading — the highest of the last six settlements — would reverse the summer's decline in the borrow; above 44,268,929 shares would set a new series high. A continued fall from 16,728,543 would extend the drain instead.
Methodology and data notes
- As-of & limits: The lenses rest on different clocks, none live: 13F is a June 30, 2026 snapshot published up to 45 days later; Form 4 windows run through October 2, 2026 (the last Newmont filing in the parsed record is itself dated October 2, 2026); Congress aggregates run through October 3, 2026 (Senate through October 1, 2026); 13D/G through April 29, 2026; short interest through September 15, 2026; the price file ends October 2, 2026. Nine limits are specific to this audit. First, the roster expanded before the recent audits — from 85 managers (83 filing) to 149 (147 filing) — so "of 147" counts are not comparable to earlier pieces' "of 83" figures. Second, this name's common stock carries a single CUSIP (651639106), and the full-market by-CUSIP row matches the by-ticker aggregate on every field — holders, long holders, shares, reported value, prior holders and prior reported value — so no CUSIP blending question arises. Third, the tracked register's change labels are verified, not taken on trust: all 5 continuing holders were verified by two methods that agree exactly — a total-value prefix pass and accession identity plus CUSIP-overlap pairing, each June filing paired to a unique March filing, with every label recomputing exactly and no fallback lookup needed. The registers then reconcile with no remainder: the March 31 register holds 13,721,882 shares, equal to the verified continuing holders' 13,700,732 plus Atalanta Sosnoff's exited 3,850 plus the September early filer Sarasin's March register row of 17,300; the June 30 register holds 12,779,094 shares, equal to the June cohort's 12,762,394 plus Sarasin's June register row of 16,700, against which its September label of +53.9% (to 25,700 shares) also recomputes exactly. Sarasin's September implied price is exactly $115.34, the September 30 close. Fourth, one June holder's implied price does not equal the close: DJE Kapital's row (508,750 shares, $49,705,273) implies $97.70 against the June 30 close of $93.40, while the other four holders imply $93.40 exactly; the cohort aggregate therefore implies $93.57 (+0.18%). The row is reported as printed; every share count in this audit is unaffected. Fifth, the full-market aggregate implies $95.46 against the June 30 close of $93.40 (+2.21%): the aggregate is a reported sum that includes option rows, so its implied price need not equal the close; this audit uses filer counts and share counts as this lens's primary measures and reports the value as reported only. Sixth, the insider lens rests on a single aggregate bucket — this issuer's filings sit under one symbol spelling, "NEM", with no case split — cross-checked against a row-level scan of all 124 parsed filings for the issuer (CIK 1164727): filing counts, transaction counts, share counts, officer-row counts and values reproduce exactly in every window, with a value difference of $0.00 in all three windows and no accession appearing under more than one symbol spelling. On that record, every insider implied-price check that applies passes: the 90-day implied sale price of $107.88 sits inside its filing-window close range ($89.20–$135.14), the one-year figure ($109.64) inside its range ($78.63–$135.14), and the full-record figure ($86.81) inside the full price range ($29.86–$135.14); no window holds any purchase rows, so no implied-price check applies on the buy side. The site's insider aggregate (dated October 22, 2026, a 90-day window ending that day) carries a row for this name — 0 purchases, 5 sale rows, $3,137,047.05, 3 sellers — whose counts differ from the full parse's 90-day filing-date window ending October 2 (8 sale rows) because the windows end on different dates; the two agree that there were no purchases and 3 sellers, and this audit uses the full parse throughout. Seventh, the congressional lens is absent in every file this audit reads — combined, House and Senate aggregates and the House member file — and is reported as absent; no figure is estimated for it. Eighth, the 5% register's cross-date share total of 180,838,406 is an arithmetic sum of 3 single-reporter rows across different reporters and as-of dates, including one reporter's own 0-share print, and is not a current combined stake; each print is reported individually in the text. Parsed totals match the aggregates exactly. Ninth, the short-interest series holds no step of 2x or more and no step to one-half or less (the largest step is 1.460x, at March 15, 2023, from 9,746,790 to 14,231,843 shares; the smallest is 0.634x, at March 31, 2022), so the series is continuous on this measure across its full span. No row carries a split flag; four rows carry a FINRA revision flag (June 15, 2021; May 31, 2023; April 30, 2024; November 28, 2025). The issuer-name field reads "Newmont Corporation" at all 137 settlements, on a single market class (NYSE) throughout. The share count behind the short-interest percentage is 1,053,692,271 shares in our fundamentals file, a measured period-end count (dei/EntityCommonStockSharesOutstanding, as of July 16, 2026), so the 1.59% figure rests on a measured denominator. Our price file records no single-day close move across the thresholds this audit normally treats as split patterns, and records no split factor for this name. The company's fundamentals as collected print fiscal 2025 revenue of $22,669,000,000, net income of $7,085,000,000 and assets of $57,121,000,000; those figures are reported as collected and are not used in any lens above. Every price statement from our own file is mechanical, a date and a close. The October figures in The Hype — the October 22 earnings date and the consensus estimates — are events published after our price file ends, and are cited as such, not blended into file-based calculations.
- Market context sources: WEEX TradFi Daily, October 22, 2026 (Newmont among the October 22 earnings-focus names, after the close; consensus EPS about $1.94; focus on gold production, all-in sustaining costs and cash flow; gold near $4,115). TickerOn earnings preview, October 2026 (adjusted EPS consensus range $1.96–$2.18; revenue near $6.0–6.2 billion against $1.71 and $5.52 billion a year earlier; full-year 2026 guidance of roughly 5.26 million ounces of gold output and all-in sustaining costs of $1,680 per ounce). Seeking Alpha, October 21, 2026 (Q3 2026 EPS expected at $1.94, up 13.5% year over year; revenue $6.26 billion, up 13.4%). Google Trends US daily snapshot via Cyber Kendra, updated October 22, 2026 (top queries are sports and entertainment names; no stock query appears, so the earnings-focus selection above is the fallback basis). Figures we could not confirm were left out; the external items above are reported figures from those outlets, not GetCoattail measurements.
- Newmont is in the GetCoattail stock-page universe: Newmont (NEM) stock page. Series data: nem_lens_data.csv · nem_short_interest_series.csv. Earlier audits: Union Pacific · Procter & Gamble.
Past patterns are not a promise of future results. For education only — not investment advice.
This article describes public filings as of the dates stated. It is not investment advice and makes no recommendation. Filings lag reality: 13F positions are as of June 30, 2026, and later trading is not yet public.
Revision history: v1.0 — October 22, 2026: first publication.