GetCoattail Research — The Filing Tape #80. NetApp fell about 3.7% on October 14 in Barron's account of a Barclays downgrade, and the filings describe a tracked cohort whose entire position is one manager's new 4,375-share entry, a full market that added 23.9 million shares, an insider record with zero officer purchases, no congressional record at all, and a borrow 57.6% below its May 2026 peak.
The Hype
NetApp became a market story on October 14 for the wrong reason. Barron's market-movers coverage recorded the shares down about 3.7% that day, after Barclays cut its rating on NetApp — and on Hewlett Packard Enterprise and Dell as well — to Equal Weight from Overweight, judging that no meaningful AI inflection had arrived yet. Barclays kept its $219 price target on NetApp unchanged, according to summaries carried by StockTwits and TradingView, and Barchart's movers summary likewise put NetApp down more than 2%, Dell down more than 6% and Hewlett Packard Enterprise down more than 4%. The cut landed on a stock that, in our own daily-close file, had already run hard: the file ends October 2 at $226.27 — itself the 252-session closing high, up 111.3% year to date, after a 51.1% rise in the second quarter alone. The filings below ask a prior question: who held the stock before the downgrade was written.
The Tape
For NetApp — the eightieth Filing Tape audit — the tape shows a one-name tracked cohort whose whole position was opened in the second quarter even as the full market added 23,868,233 shares, an insider record containing no officer purchase at all against 83 sales, no congressional record in any aggregate, a 5% register that is entirely passive filings peaking at 13.83%, and a borrow 57.6% below its series maximum.
| Lens | As of | What the filings show | Direction vs prior period |
|---|---|---|---|
| Superinvestors (13F) | Jun 30, 2026 | 1 long holder; 4,375 shares; $677,075 | Holders 0 → 1; the only holder is new |
| All institutions (13F) | Jun 30, 2026 | 962 filers; 192,518,776 shares | Filers +116; shares +14.15% |
| Insiders (Form 4) | Oct 2, 2026 | 0 officer purchases in the full parsed record; last 90 days: 18 sales | No purchase in the last year; 3 non-officer purchases in the full record |
| Congress | Oct 3, 2026 | No record in the combined, House or Senate aggregates | No row in any aggregate |
| 13D/G | Apr 30, 2026 | 7 parsed filings (all SC 13G-family); register maximum 13.83% (The Vanguard Group) | Latest filing reports 7.29% as of Mar 31, 2026 |
| Short interest (FINRA) | Sep 15, 2026 | 10,146,420 shares; 5.17% of shares outstanding | Down 57.6% from the series maximum; down 4.8% year over year |
Lens 1 — the superinvestors: one holder, and it arrived this quarter. We track 83 large, mostly long-only managers whose 13F portfolios we collect directly from SEC EDGAR. As of June 30, 2026, 1 held NetApp long, totalling 4,375 shares worth $677,075, with no option rows — every row on the single CUSIP. Lee Ainslie - Maverick Capital holds all 4,375 shares worth $677,075 — 100.0% of the cohort's position — at a 0.01% weight, and the position is labelled NEW: the cohort held no NetApp at all at March 31, no tracked manager exited, and the quarter comparison for this lens is a single entry, from zero holders to one. The implied price, $154.76, sits exactly on the June 30 close. 13F figures are as of June 30, 2026; funds have up to 45 days to file, so this picture is complete — and always lagging.
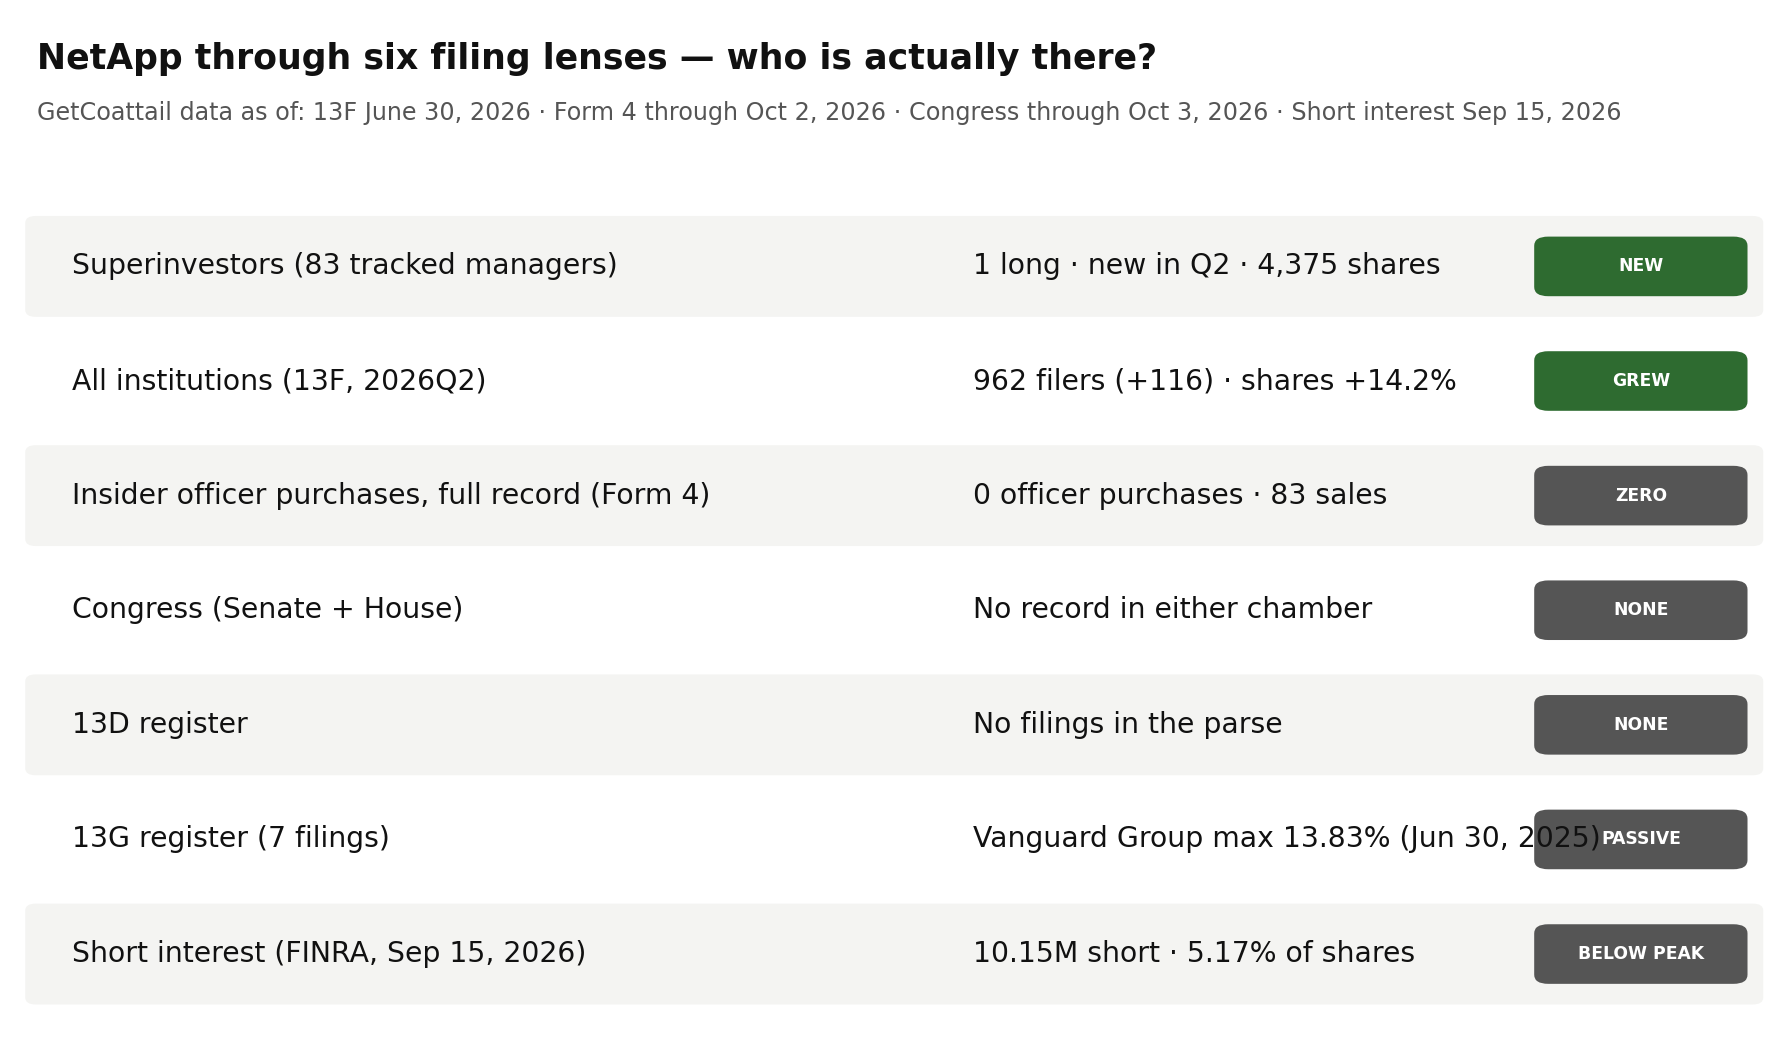
Lens 2 — institutions: 116 more filers, 23.9 million more shares. At June 30, 2026, 962 institutions reported positions, up 116 from 846 at March 31 (+13.71%), 953 of them long. Reported shares rose 14.15%, from 168,650,543 to 192,518,776 shares. Reported value rose 74.30% to $28,622,253,597; the aggregate includes option rows, so we headline filer and share counts and label dollars "reported" (see methodology). The name reports under a single CUSIP, and the by-CUSIP row matches the by-ticker totals exactly on every field. The full market added shares at a pace the tracked cohort barely joined — the cohort's entire position is 4,375 shares, opened in this same quarter.
Lens 3 — insiders: no officer purchase in the entire parsed record. The parsed Form 4 record holds 133 filings through October 2, 2026, and zero officer purchase transactions — in the last 90 days, in the last year, and across the full record. The record's only purchases are 3 transactions across the full record, totalling 5,524 shares and $499,597.32, all by a single buyer who is not an officer; the last 90 days and the last year each hold no purchase at all. The 90-day window holds 18 sale transactions totalling 158,524 shares and $31,769,076.36, by 5 sellers, 15 of the 18 of them officer sales. Across the last year the record holds 37 sales totalling 225,232 shares and $41,884,383.37, by 7 sellers, 33 of the 37 of them officer sales; across the full record, 83 sales totalling 404,246 shares and $60,989,131.85, by 8 sellers, 79 of the 83 of them officer sales. We assign no motives; this is a register of sales with an empty officer purchase column, and this audit describes it as exactly that.
Lens 4 — Congress: no record at all. The combined record (as of October 3, 2026) carries no NetApp row. The House aggregate (as of October 3, 2026) carries no row, and the Senate aggregate (as of October 1, 2026) carries no row either. There is no purchase, no sale, no member and no date to report from our congressional collections for this name.
Lens 5 — the 5% register: seven filings, all passive, five reporting names. Our full parse holds exactly 7 SC 13D/G filings — two SC 13G and five SC 13G/A amendments, with no SC 13D-family filing at all — 7 reporting-person rows across 5 names, most recently filed April 30, 2026, matching the site aggregate's ticker-keyed row on every headline field. The register's maximum is The Vanguard Group reporting 27,728,118 shares (13.83%) as of June 30, 2025; the same reporting name later prints 0 shares (0.0%) as of March 13, 2026. The remaining rows are reported exactly as filed and not combined: BlackRock, Inc. reports 19,367,597 shares (9.5%) as of March 31, 2025; PRIMECAP MANAGEMENT CO/CA/ reports 12,220,339 shares (6.01%) as of December 31, 2024 and then 9,630,055 shares (4.82%) as of September 30, 2025; Vanguard Portfolio Management reports 12,718,223 shares (6.44%) as of March 31, 2026; and Vanguard Capital Management reports 14,399,983 shares (7.29%) as of March 31, 2026. There is no activist filer in this register at all.
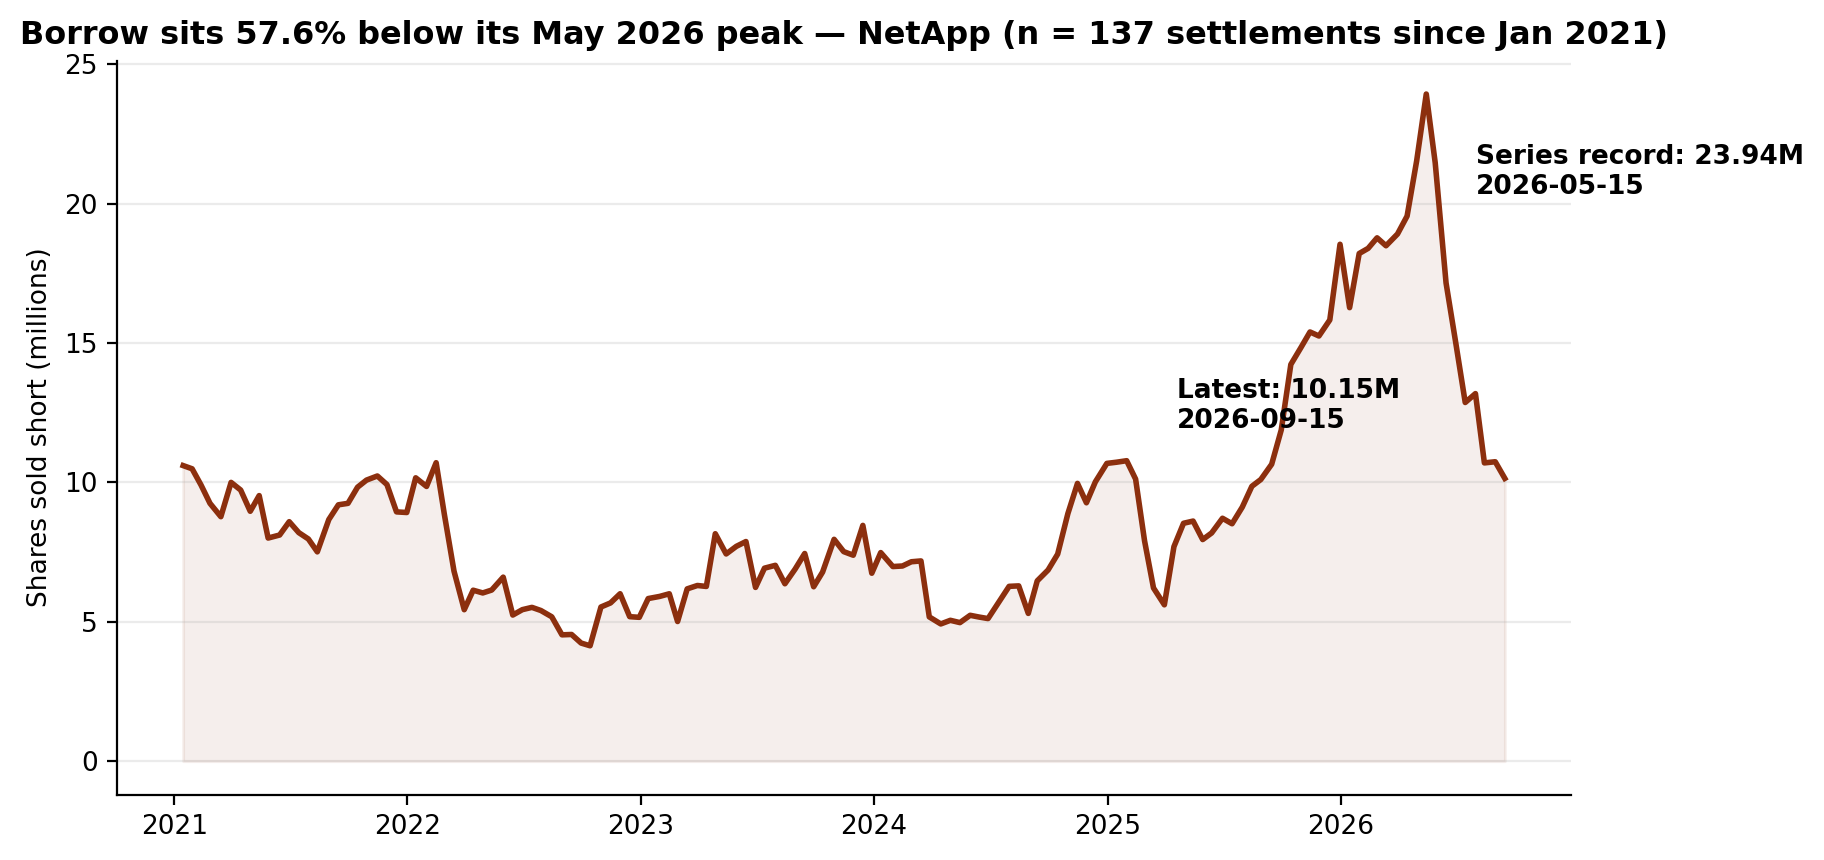
Lens 6 — short interest: 10,146,420 shares, more than half below the peak. As of September 15, 2026 — the most recent of 137 FINRA settlements since January 15, 2021 — 10,146,420 shares were sold short, down 5.57% from the prior settlement. The series maximum, 23,938,366 shares on May 15, 2026 — verified by a maximum query over the whole series — leaves the latest 57.6% below it. The last five settlements read 12,870,550, 13,189,329, 10,702,997, 10,744,430 and 10,146,420. Against the year-ago 10,654,771 shares the latest is down 4.8%; against the June 30, 2026 settlement of 15,037,225 it is down 32.5%. Against 196,419,005 shares outstanding, it is 5.17% of the share count, at 3.64 days to cover.
The Gap
The narrative, as the downgrade coverage frames it, is a waiting question: the AI payoff has not yet shown up as a meaningful inflection, so a stock that had risen 51.1% in the second quarter and 46.2% more since quarter-end — on our price file, through October 2 — fell about 3.7% on October 14. The filings describe who held the stock before that question was asked, and the two ownership lenses differ mostly in scale. The full market held 192,518,776 reported shares at June 30, up 23,868,233 shares (+14.15%), as its filer count rose by 116 to 962. The tracked cohort held 4,375 shares — one new position, opened by Maverick Capital in this quarter, at a 0.01% portfolio weight — after holding none at all at March 31. The 5% register holds no activist at all — passive filings whose reported maximum, 13.83%, dates to June 30, 2025, and whose largest reporting name has since printed zero under its own name. Insiders have recorded no officer purchase against 83 sales, and sold $31,769,076.36 in the last 90 days; the record's only purchases, 3 transactions by one non-officer buyer, sit outside the last year. Congress has no record for this name in any aggregate. The borrow, at 10,146,420 shares and 5.17% of the share count, is less than half its May 2026 peak. One plausible reading is that broad accumulation and a rising price carried the register while the tracked cohort's participation began, at minimal size, only in the quarter the price rose 51.1% — and officers sold into the same quarters. The record supports each clause separately; it does not say which side the next quarter favours.
What Would Change the Picture
Nothing above is a recommendation. It is a record. These filings would change the description:
- 1. The 2026Q3 13Fs (filing window closing mid-November 2026). The cohort held 4,375 shares at June 30 — one holder, Maverick Capital, in a position opened that quarter. Maverick adding, holding or exiting decides this lens on its own; so does any second tracked manager appearing in a register that had zero holders at March 31.
- 2. A first officer purchase — the record currently has none. The parsed record holds zero officer purchase transactions across 133 filings, in every window, and no purchase of any kind in the last year. A single officer purchase breaks a register whose officer column is currently empty.
- 3. A fresh 5% print, or any SC 13D at all. The register's latest filing is dated April 30, 2026 and reports 7.29% as of March 31, 2026; its maximum, The Vanguard Group's 13.83%, is as of June 30, 2025, and every filing in the parse is passive. An activist 13D would be this lens's first.
- 4. Whether the borrow rebuilds toward its May 2026 level, or fades toward its low. Short interest stands at 10,146,420 shares, 57.6% below the series maximum of 23,938,366. A reading back above the June 30 print of 15,037,225 extends a rebuild; a reading below the series minimum of 4,141,209 sets a new series low.
- 5. A first congressional record of any kind. The combined, House and Senate aggregates carry no row for this name at all. A single reported purchase or sale gives this lens its first entry in any column.
As-of & Limits
The lenses rest on different clocks, none live: 13F is a June 30, 2026 snapshot published up to 45 days later; Form 4 runs through October 2, 2026; Congress through October 3, 2026 (Senate through October 1, 2026); 13D/G through the April 30, 2026 filing; short interest through September 15, 2026; our price file ends October 2, 2026. Two limits are specific to this name. First, the October 14 downgrade — the reason for the search interest — postdates every lens here, and the downgrade-day price move is known to this audit only from outside coverage, not from our own price file, so nothing in the tape yet reflects positioning after it. Second, the congressional lens is an absence in our aggregates, reported as such: our combined, House and Senate collections carry no row for this name.
Related reading: Three of 83: Ariel Is 90.2% of the Superinvestors' Hewlett Packard Enterprise Stake. Its Insiders Have Never Bought a Share. — Filing Tape #79; Six of 83: ValueAct Is 67.0% of the Superinvestors' BlackRock Stake. Its Insiders Have Never Bought a Share. — Filing Tape #78; Twelve of 83: One Holder Is 47.7% of the Superinvestors' Johnson & Johnson Stake. Its Insiders Have Bought Once. — Filing Tape #77. NetApp's own page: NetApp (NTAP) on GetCoattail.
Methodology and data notes
- Superinvestor lens: 83 managers collected directly from SEC EDGAR Form 13F (managers_13f collection), positions as of June 30, 2026; NetApp identified by its single CUSIP 64110D104. One distinct manager holds a long position totalling 4,375 shares; there are no option rows for this name in the collection. The direction count on the collection's labels, across the long rows, is one NEW (Lee Ainslie - Maverick Capital); the collection's exit list carries no NetApp row. Lee Ainslie - Maverick Capital's share of the cohort is 100.0% = 4,375 / 4,375. Quarter-to-quarter cohort totals require care in this audit: the site pipeline's holdings files now cover 147 accessions (an expanded roster), so their CUSIP totals — 2,757,268 shares in 2 rows at March 31 and 2,623,181 shares in 3 rows at June 30, a change of −4.86% — are not the 83-manager cohort; the second-quarter file carries two rows outside the EDGAR collection totalling 2,618,806 shares (2,465,831 and 152,975), and neither first-quarter pipeline row belongs to a cohort manager. The cohort comparison printed in this audit (0 long shares at March 31, in 0 rows; 4,375 long shares at June 30, a change of +4,375 shares on a single NEW entry) is built manager by manager: the cohort manager's pipeline row was matched by the manager's EDGAR total portfolio value (accession 0000947871-26-000793), that accession carries no NetApp row in the first-quarter file, and the manager is labelled NEW in the EDGAR collection.
- Full-market lens: SEC Form 13F Data Sets full-market aggregation. The primary table is the full13f collection's by-ticker file (holders = distinct filers reporting the CUSIP; 953 reported long positions out of 962 filers). NetApp reports under a single CUSIP, 64110D104, and the backfill fixtures' by-CUSIP row matches the by-ticker row exactly on holders, long holders, shares, reported value, prior holders and prior value. The by-ticker file's entered/exited fields (860 and 744, a net of +116 that matches the change in holder count) are gross flows, so this audit headlines the net change. Reported-value caution: the aggregate value ($28,622,253,597 over 192,518,776 shares) implies $148.67 per share against a June 30, 2026 close of $154.76 in our price file, a gap of −3.9% — printed here as found. The aggregate sums the VALUE of every information-table row — including put and call option rows — while the share count covers long common-stock rows only, so we headline filer and share counts and label dollar values "reported."
- Insider lens: full-parse Form 4 aggregation (agg_by_ticker), record as of October 2, 2026 (133 filings). Sale and purchase counts are transaction-code counts (S and P) in non-derivative rows; grants and exercises are not counted as purchases, and one filing can contain many transaction rows. Officer purchase transactions total zero in the full parsed record — zero in the 90-day window (July 5 to October 2, 2026), zero in the one-year window and zero across the record. Purchase transactions of any kind total zero in the 90-day and one-year windows and 3 across the parsed record (5,524 shares, $499,597.32, 1 buyer, none of them an officer). Sale transactions total 18 in the last 90 days (158,524 shares, $31,769,076.36, 5 sellers, 15 of the 18 of them officer sales), 37 in the last year (225,232 shares, $41,884,383.37, 7 sellers, 33 of the 37 officer sales) and 83 across the parsed record (404,246 shares, $60,989,131.85, 8 sellers, 79 of the 83 officer sales). The site's insider aggregate (compiled as of October 14, 2026, over its own 90-day window) reports 0 purchases, 17 sales and 5 sellers with $31,598,156.36 of sale value: its window ends 12 days after the full parse's, and its sale count and value sit one transaction and $170,920.00 below the full parse's 90-day window — the two windows are not the same window, so this audit cites the full parse throughout and does not describe the two as matching. The full-parse aggregate's sale-value totals imply $200.41 per share for the 90-day window, $185.96 for the one-year window and $150.87 for the full record, each inside the traded price range of its window on our price file ($159.69 to $226.27 for the 90-day window, $94.11 to $226.27 for the one-year window, and $58.18 to $226.27 across the price file), and its full-record purchase total implies $90.44 per share, also inside the full-record range, so the totals are cited as figures in this article. "No officer has ever bought" in this audit means zero officer purchase transactions in the parsed Form 4 record we maintain; it is a statement about that record, not about any individual's complete history.
- 13D/G lens: full-parse SC 13D/G parsed filings (7 filings matching issuer CIK 1002047 on CUSIP 64110D104: two SC 13G and five SC 13G/A filings, the latter amendments, with no SC 13D-family filing), filings through April 30, 2026. The site aggregation carries this name under a ticker-keyed row; that row (7 filings, 0 D-filings, 7 G-filings, 5 amendments, 5 reporters, latest date April 30, 2026, maximum 13.83% and 96,064,315.0 reported shares) matches the parsed filings on filings, form mix, amendments, latest date, maximum and reported-share total. The parsed reporting-person rows sum to 96,064,315.0 shares, but that total sums reporting-person rows across different dates, so it is not used as a stake figure in the article. The rows are reported as filed, under the names exactly as they appear: The Vanguard Group printing 27,728,118 shares at 13.83% as of June 30, 2025, filed July 29, 2025 as SC 13G/A, and 0 shares at 0.0% as of March 13, 2026, filed March 27, 2026 as SC 13G/A; BlackRock, Inc. printing 19,367,597 shares at 9.5% as of March 31, 2025, filed April 23, 2025 as SC 13G/A; PRIMECAP MANAGEMENT CO/CA/ printing 12,220,339 shares at 6.01% as of December 31, 2024, filed February 13, 2025 as SC 13G/A, and 9,630,055 shares at 4.82% as of September 30, 2025, filed November 14, 2025 as SC 13G/A; Vanguard Portfolio Management printing 12,718,223 shares at 6.44% as of March 31, 2026, filed April 29, 2026 as SC 13G; and Vanguard Capital Management printing 14,399,983 shares at 7.29% as of March 31, 2026, filed April 30, 2026 as SC 13G. The three Vanguard reporting names are separate rows as filed and are not combined in this audit. The parsed coverage for this issuer holds these 7 filings; a 5% holder that has not filed in the covered window would not appear here.
- Congress lens: Senate PTR archive and House PTR archive as maintained on this site. The combined record (as of October 3, 2026) has no NetApp row; the House aggregate (as of October 3, 2026) has no row; the Senate aggregate (as of October 1, 2026) has no row. This audit reports the absence exactly as the aggregates stand and does not fill the lens with figures from outside those collections.
- Short interest lens: FINRA Equity Short Interest files (biweekly settlement dates), collected directly from FINRA's public distribution. The published series covers 137 settlements from January 15, 2021 (first settlement in the series, 10,606,553 shares) to September 15, 2026. The latest reading is 10,146,420 shares on September 15, 2026, down 5.57% from the prior settlement (10,744,430 on August 31, 2026). The series maximum is 23,938,366 shares on May 15, 2026 (verified by a maximum query over the series, not read off the latest row), so the latest reading sits 57.6% below the maximum. The year-ago settlement (September 15, 2025) printed 10,654,771 shares, so the latest reading sits 4.8% below a year ago. The series minimum is 4,141,209 shares on October 14, 2022. The June 30, 2026 settlement printed 15,037,225 shares, so the latest reading sits 32.5% below the 13F snapshot date's borrow. FINRA publishes each settlement about two weeks after the fact, so the October price action is not yet in this series. The share-count ratio (5.17%) uses the fundamentals file's shares-outstanding figure below.
- Fundamentals note: our fundamentals collection carries NetApp's revenue of $6,925,000,000, net income of $1,276,000,000 and assets of $10,744,000,000, each labelled fiscal 2026 in the file. The file is marked ok for this name, with no missing fields: shares outstanding of 196,419,005 (as of August 28, 2026 in the file, sourced in the file to the share count) and a file-computed market value of $44,871,921,092.83. The file does not flag the issuer as a foreign private issuer, and it carries SIC 3572, Computer Storage Devices. The file's price for the name is $228.45 as of October 6, 2026; our daily-close file ends October 2, 2026 at $226.27, and we keep the two files' figures separate rather than blending them.
- Prices: our own daily-close file for NetApp through October 2, 2026 ($226.27 close, +111.3% year to date on that file; the last close is itself the 252-session closing high, so it sits 0.0% below it; 252-session closing low $94.11 on January 20, 2026, so the last close sits 140.4% above it; closes of $102.39 at March 31, 2026 and $154.76 at June 30, 2026, a second-quarter change of +51.1%; change from June 30 to October 2 of +46.2%; change from the September 30, 2025 close of $118.46 of +91.0%). The series in our price file begins June 1, 2021 at $76.71 and holds 1,342 rows.
- Market context sources: Google Trends United States mirror (checked October 15, 2026; the mirror's top ten entries were non-stock topics, so the selection moved to the next source); Barron's October 14 market-movers coverage (checked October 15, 2026; among the names in its headline — CoreWeave, Hewlett Packard Enterprise, Dell, Bank of America, Morgan Stanley and Bending Spoons — all are already audited in this series, and in the body the same coverage groups NetApp with Dell and Hewlett Packard Enterprise as the three names Barclays cut to Equal Weight from Overweight, judging that no meaningful AI inflection had arrived yet; NetApp was the only name in that downgrade trio not yet audited in this series and not previously set aside, and the same coverage recorded NetApp down about 3.7% on October 14); StockTwits' October 14 downgrade summary (checked October 15, 2026; its headline names the same three stocks, and it reports that Barclays maintained its $219 price target on NetApp); Barchart's October 14 movers summary (checked October 15, 2026; it likewise put Dell down more than 6%, Hewlett Packard Enterprise down more than 4% and NetApp down more than 2% on the same downgrade). Figures we could not confirm against two sources were left out; the external items above are reported speech from those outlets, not GetCoattail measurements.
- NetApp is in the GetCoattail stock-page universe: NetApp (NTAP) stock page. Series data: ntap_lens_data.csv · ntap_short_interest_series.csv. Earlier audits: Hewlett Packard Enterprise · BlackRock.
Past patterns are not a promise of future results. For education only — not investment advice.
This article describes public filings as of the dates stated. It is not investment advice and makes no recommendation. Filings lag reality: 13F positions are as of June 30, 2026, and later trading is not yet public.
Revision history
- v1.0 — October 15, 2026: first publication.