SpaceX is having an earnings season right now, and you are not invited. The company is private. It publishes no earnings release, files no 10-Q, and answers to its investors behind closed doors. But some of those investors have a public obligation of their own: every quarter, large institutional managers file Form 13F with the SEC, listing what they held. SpaceX shares sit inside those filings — with a dollar value attached, assigned by the filer. This quarter, for the first time in the data we process, those values add up to something remarkable: 1,766 filers reporting the same SpaceX line, $650.6 billion of reported value, and — among the sixteen best-known funds we track — sixteen identical prices for a stock that has no price.
Why the filings are the only window
Form 13F is a peculiar document. It is filed by institutional managers with at least $100 million in reportable securities, it is dated to the last day of the quarter, and it is due within 45 days after quarter-end — so it is always a photograph of the past, never a live feed. It shows long positions only. For listed stocks, a 13F line is a cross-check against a market price anyone can look up. For a private company like SpaceX, the line is the whole story: the shares, and the value the filer chose to print next to them. There is no tape to compare it with.
That makes the value column the interesting part. Divide the reported value by the shares on the same line and you get what we call an implied mark — the per-share valuation the filer put its name to, as of June 30, 2026. It is not a market price, and this article will not treat it as one. But it is a number a regulated institution filed with the SEC, and when 1,766 filers file numbers for the same security, the pattern of agreement and disagreement is itself information.
What we measured
We pulled every SpaceX line from two sources: our tracked-fund collection (147 managers whose Q2 2026 filings we collect and check individually) and the SEC's market-wide Form 13F data sets, aggregated by CUSIP, covering every quarter from 2016Q3 to 2026Q2. The main line is CUSIP 84615Q103, filed under the name SPACE EXPLORATION TECHN CORP and class titles such as "CLASS A COM STK". We also inventoried every other SpaceX CUSIP in the same quarter, and we checked the main CUSIP's history across all 39 quarterly aggregate files in our data store. All figures below are as of June 30, 2026; the tracked filings were in by August 14, 2026.
The sixteen: unanimity
Sixteen of our 147 tracked funds report the Class A line. Between them they report 421,343,514 shares and $71,990,752,742 of value. And every single one of them — D1 Capital with 126.0 million shares, Polen Capital with 6,705 — divides out to the same implied mark: $170.86 a share. Not approximately. The highest of the sixteen marks exceeds the lowest by four ten-thousandths of a dollar, the gap that rounding to whole dollars explains. Sixteen independent filers, position sizes spanning more than four orders of magnitude, one number.
| Tracked fund | Shares reported | Reported value | Share of the fund's 13F book |
|---|---|---|---|
| D1 Capital Partners | 126,042,232 | $21,535,575,760 | 61.91% |
| Capricorn Investment Group | 120,801,820 | $20,640,198,965 | 91.78% |
| Darsana Capital Partners | 101,461,915 | $17,335,782,797 | 77.85% |
| Alpha Wave Global | 31,246,965 | $5,338,856,440 | 85.53% |
| Coatue Management | 18,561,780 | $3,171,465,731 | 6.52% |
| SCGE Management (Sequoia Capital Global Equities) | 16,981,350 | $2,901,433,460 | 49.2% |
| Sands Capital Management | 2,276,744 | $389,004,480 | 1.44% |
| Winslow Capital Management | 1,345,148 | $229,831,987 | 0.79% |
| Viking Global Investors | 1,200,000 | $205,032,000 | 0.58% |
| Chase Coleman - Tiger Global Management | 375,000 | $64,072,500 | 0.27% |
| Samlyn Capital | 350,000 | $59,801,000 | 0.97% |
| David Tepper - Appaloosa Management | 225,000 | $38,443,500 | 0.5% |
| Daniel Loeb - Third Point | 180,415 | $30,825,707 | 0.66% |
| Whale Rock Capital Management | 152,517 | $26,059,055 | 0.21% |
| Atalanta Sosnoff Capital | 135,923 | $23,223,744 | 0.41% |
| Polen Capital Management | 6,705 | $1,145,616 | 0.01% |
Two more facts frame the sixteen. First, every position is new to the filings: all sixteen carry a "new" flag against the filer's own March 31, 2026 report, meaning none of the sixteen reported this CUSIP in the prior quarter. Second, the position is not a footnote for most of them. For four of the sixteen — Capricorn Investment Group (91.8% of its reported book), Alpha Wave Global (85.5%), Darsana Capital (77.9%) and D1 Capital (61.9%) — SpaceX is the majority of everything they reported on Form 13F. The top three holders account for 82.7% of the tracked value. One plausible reading of the identical mark is that these funds are drawing on a common valuation reference — a recent transaction or tender print would produce exactly this fingerprint — but the filings do not say where the number came from, and we do not claim to know.
The wider market: agreement ends at the tracked funds
Beyond the tracked list, the Class A CUSIP was reported by 1,766 filers in total (1,736 of them in long share rows), covering 3,665,814,016 shares and $650.6 billion of reported value. The share-weighted aggregate mark across all of them is $177.46 — above the tracked funds' $170.86. Subtract the tracked sixteen and the remaining 1,750 filer rows average, in aggregate, $178.32. Our sixteen funds are 11.5% of the reported shares, so the "$177.46" headline is mostly other people's marks.
Here the data imposes honesty about its own limits. Our market-wide store is aggregates, not per-filer records, so we cannot show you the distribution of those 1,766 marks — no median, no spread. We can say the aggregate sits above the tracked funds' unanimous mark; we cannot say whether that is a few large filers marking high or a broad disagreement. What a reader can do with this is narrower and more useful: when a single "SpaceX is valued at $X per share" figure circulates, ask which filers, which line, and which quarter it came from — because the filings do not speak with one voice beyond the sixteen above.
The other lines: where the dispersion lives
The Class A CUSIP is not the only SpaceX line in the quarter. Seven sibling CUSIPs — same issuer, other reported lines — add 60 filer rows, and their aggregate implied marks are nowhere near each other: $143.74 (20 filers), $146.15 (1 filer), $170.86 again (1 filer), $1,909.12 (19 filers) and $4,756.83 (17 filers). Two further lines report dollar value — $1,366,880 and $85,430 — against zero shares, so no per-share mark exists for them at all.
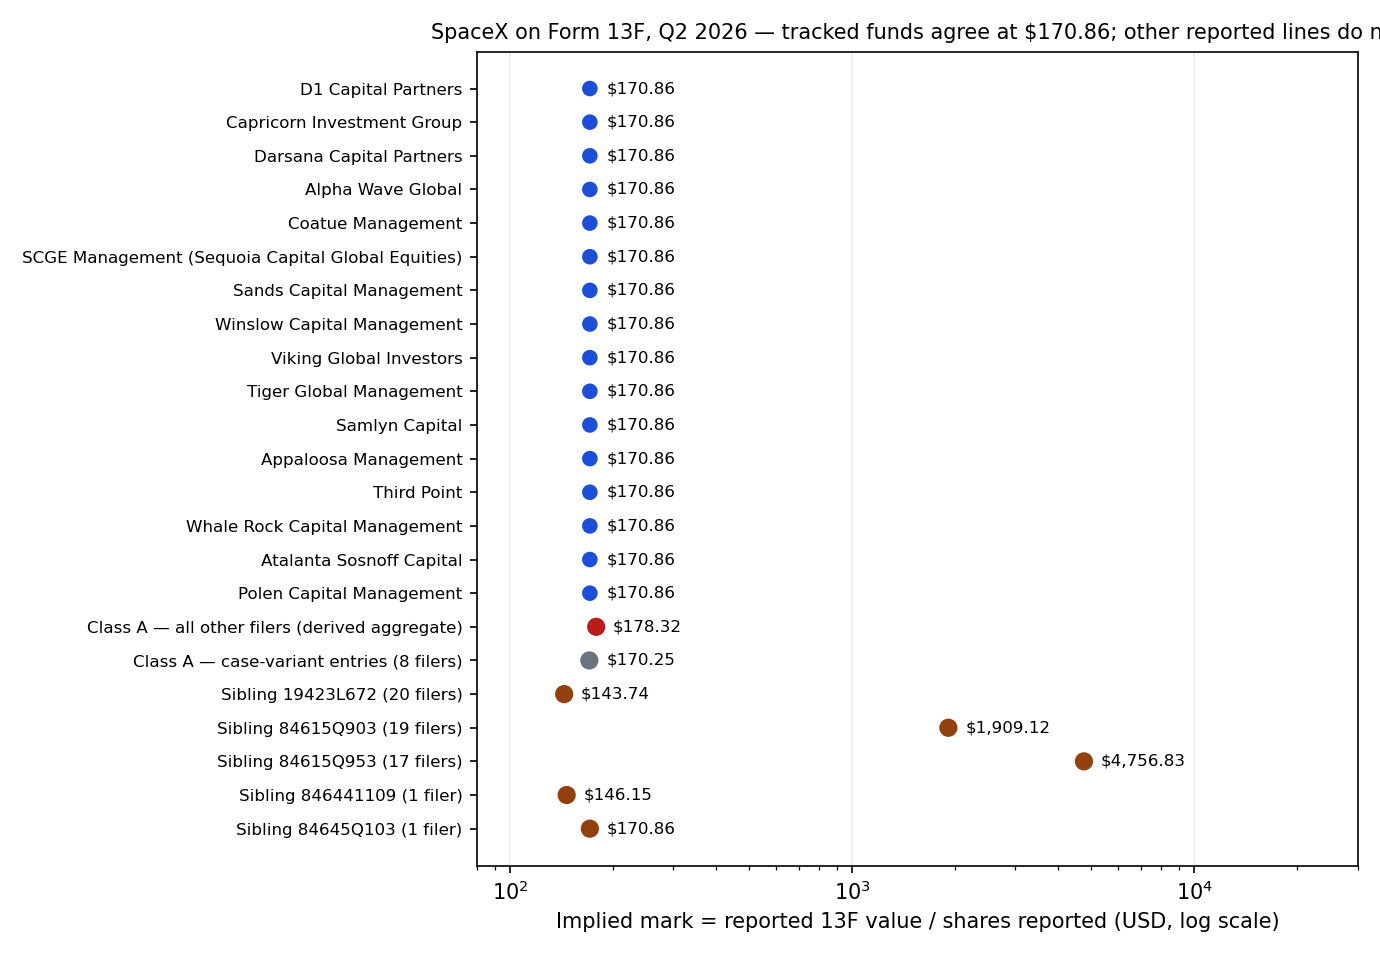
This is the part of the picture that disciplines the rest. A mark of $4,756.83 is not a claim that SpaceX is "worth" twenty-eight times the tracked funds' number; the likeliest explanations are duller — a different class or unit of the same issuer, or a filer reporting convention that divides value by something other than ordinary shares. Share-class and unit differences, and filers' own valuation policies, can plausibly generate most of this dispersion, and from aggregates we cannot decompose it further. What the dispersion does establish is that "the 13F value of SpaceX" is not one number. It is a stack of filer-specific numbers attached to lines that share a company name — sometimes identical to the cent, sometimes different by a factor of thirty-three.
A CUSIP with one quarter of history
The strangest fact in the data is temporal. We searched every quarterly aggregate file in our store — 2016Q3 through 2025Q4, by issuer name and by CUSIP — and CUSIP 84615Q103 appears in none of them. It arrives in 2026Q2 with 1,766 filers at once; the by-ticker rollup independently records zero prior holders and 1,766 entrants. (One gap, declared: the 2026Q1 aggregate file is not in our store, so that quarter is recorded as "no data", not as zero.) Whether the debut reflects the identifier being standardised, the data set's coverage, or holders crossing reporting thresholds is not something the aggregates can answer. The filings record an arrival, not an explanation.
What would change this picture
Nothing above is a recommendation. It is a record, and records update. The next public window is already scheduled: Q3 2026 Form 13F filings (period September 30, 2026) are due by November 16, 2026. Three things to check when they land — all on the funds' own pages here, where each new filing is summarised against the last:
1. Persistence. Do the 1,766 filers and the sixteen tracked funds still report the line — and does the CUSIP stay the same?
2. Convergence. If the tracked funds print $170.86 again while the quarter has moved on, the "common reference" reading weakens; if the market aggregate and the tracked mark meet, it strengthens.
3. The siblings. Whether the extreme sibling marks persist, shrink, or turn out to be one-quarter reporting artefacts is the cleanest test of how much of the dispersion was ever real.
SpaceX will keep reporting its results privately. The filings will keep reporting around it — late, partial, and, as this quarter shows, occasionally in perfect unintended unison.
Methodology and caveats
Implied mark = reported value ÷ shares reported, on the same filing line. Tracked-fund values are the value_usd field of our managers collection (dollars; the pipeline applies the ×1000 unit correction that raw 13F values require). Market-wide values are the SEC Form 13F data sets' valueUsd aggregates (dollars). The market-wide aggregate for CUSIP 84615Q103 is reported as keyed; the same CUSIP also appears under a lowercase key (8 filers, $58.3 million, mark $170.25). Combined Class A totals are labelled wherever used. The "all other filers" figure is a derived aggregate (market minus tracked), not a per-filer statistic. Per-filer detail market-wide is not in our data store; no market-wide mark distribution is claimed anywhere in this piece.
Implied marks are filer-reported valuations of specific share classes/units as filed. They are not market prices, and differences between them do not establish that any filer is wrong. Position values summed across filers ($650.6 billion) are sums of reported position values, not a valuation of the company. 13F shows long positions as of quarter-end, filed up to 45 days later. It says nothing about shorts, derivatives held elsewhere, or any trade after June 30, 2026. SpaceX's own financial results are not public and no figure for them appears in this piece. An independent verification pass checked the tracked values against the filers' own EDGAR information tables (Tiger Global and D1 Capital matched to the dollar) and recomputed the market aggregates from the source files with zero mismatches.
Data download
The full data table — tracked filers, market CUSIPs, and the quarterly series: spacex_13f_data.csv
Revision history
Oct 21, 2026: First published.