GetCoattail Research — The Filing Tape #104. Applied Optoelectronics arrived near the top of a mid-cap watch list after a year in which its price multiplied, and the filings describe a register that has been shrinking at the tracked end: 3 of the 147 superinvestors we track hold the stock, one is 72.9% of the cohort, the verified cohort cut its shares 31.3% in Q2, insiders have recorded no purchase in a year against 51 sales, and short interest stands at 14.55% of the share count.
The Hype
Applied Optoelectronics' attention this week is a list ranking. The stock stood third on MarketBeat's "Best Mid Cap Stocks To Watch Today" list for October 16, 2026, as carried by Ticker Report — behind an index ETF and a name our files do not cover, which makes it the highest-ranked name on that list we had not already audited in this series. The price file shows why a screener would surface it: the stock rose 75.2% in the second quarter alone, from $84.59 on March 31 to $148.16 on June 30, and stands up 231.6% year to date. It also shows the other side of the run: the last close in our file is $115.59 on October 2 — down 22.0% since June 30 and 48.2% below the 252-session closing high of $223.10, set on May 13, 2026, though still 493.1% above the 252-session low of $19.49, set on November 20, 2025.
The Tape
For Applied Optoelectronics — the one hundred and fourth Filing Tape audit — the tape shows a three-name superinvestor cohort that cut its share count by nearly a third in a quarter the price rose 75.2%, a full market that added 112 filers, an insider record whose buy side has been silent for a year, a congressional lens with no row at all, ten passive 5% filings, and a borrow equal to 14.55% of the shares outstanding.
| Lens | As of | What the filings show | Direction vs prior period |
|---|---|---|---|
| Superinvestors (13F) | Jun 30, 2026 | 3 holders of 147 tracked managers; 86,638 shares; top holder is 72.9% of the cohort | 2 DECREASED, 1 INCREASED; verified continuing holders -31.3% vs Q1; no exits |
| All institutions (13F) | Jun 30, 2026 | 487 filers; 51,004,757 shares; reported value $10,345,817,791 | Filers +112 (+29.87%); shares +7.20% |
| Insiders (Form 4) | Oct 2, 2026 | 0 purchases in the last year; 13 purchases in the full parsed record (132 filings); 65 sales | Last 90 days: 0 purchases, 7 sales |
| Congress | Oct 3, 2026 | No row in the combined, House or Senate aggregates | None recorded |
| 13D/G | Aug 10, 2026 | 10 parsed filings, all 13G family (4 SC 13G, 6 SC 13G/A); register maximum 7.25% (The Vanguard Group) | Latest filing reports Jane Street entities as of Jun 30, 2026 |
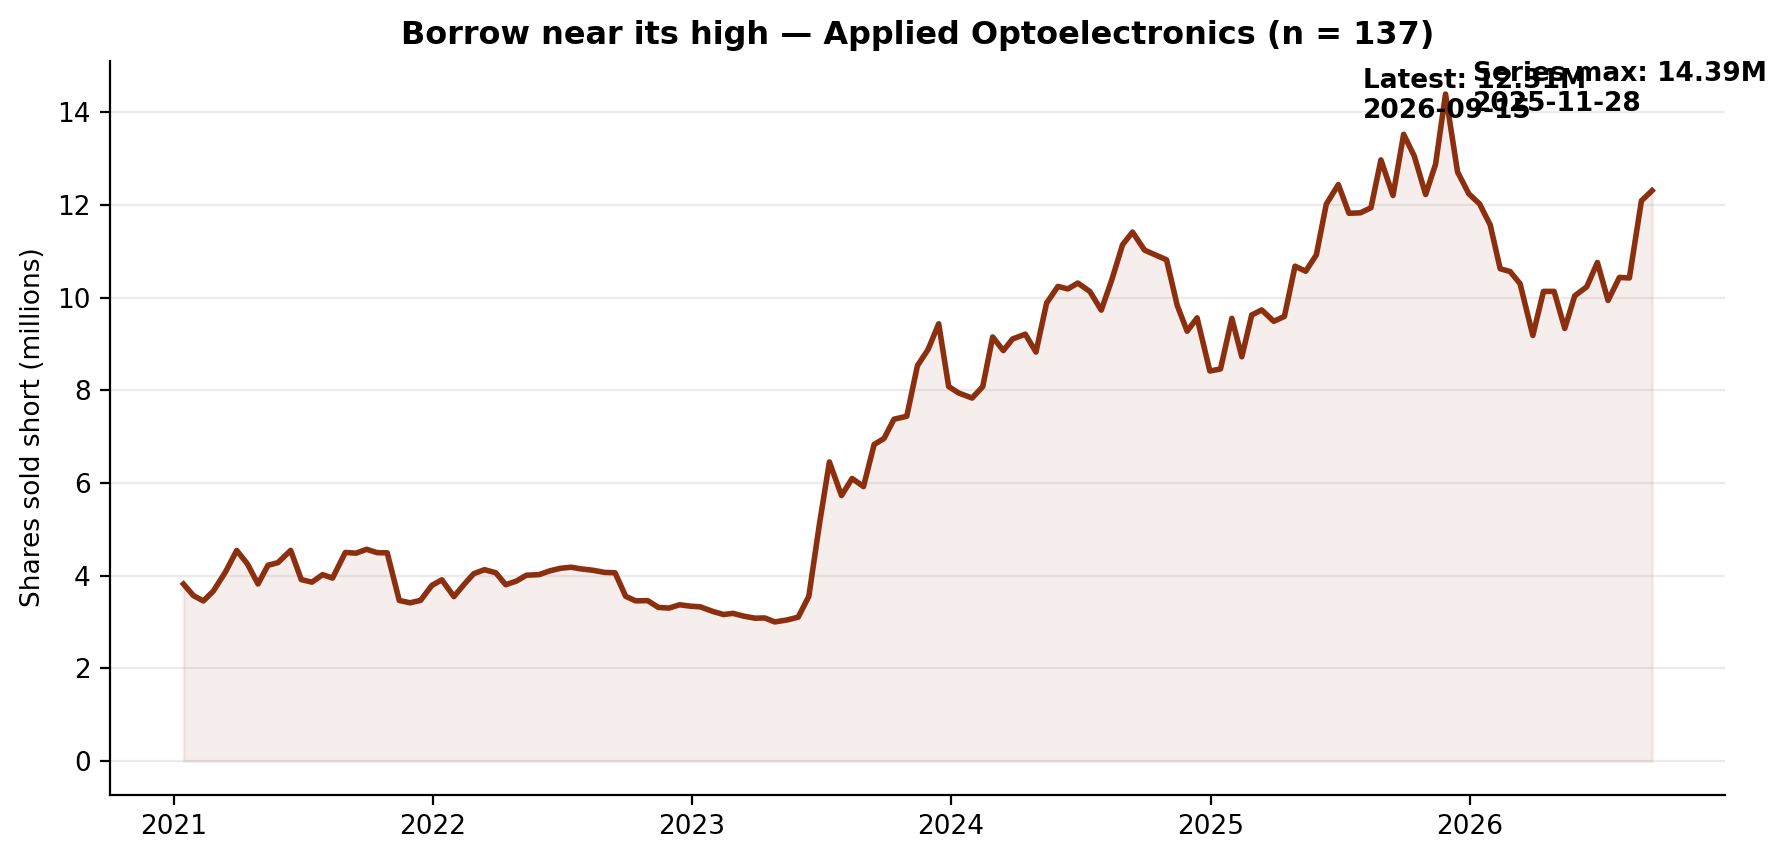
| Short interest (FINRA) | Sep 15, 2026 | 12,307,146 shares; 14.55% of shares outstanding; 1.97 days to cover | Up 1.82% from the prior settlement; down 14.5% from the Nov 28, 2025 peak |
Lens 1 — the superinvestors: three holders, one at 72.9%, and a cohort down 31.3%. We track 149 managers whose 13F portfolios we collect from SEC EDGAR — 147 are in the collection: 144 at a June 30 period-end, and 3 early filers at September 30. For this name there is no period mix and no option row: all 3 holder rows sit at June 30, 2026, on the single CUSIP 03823U102, totalling 86,638 shares worth $12,836,286, long positions only. Axiom Investors is most of the cohort: 63,178 shares worth $9,360,452 — 72.9% of the tracked stake — at a 0.08% portfolio weight, down 33.5% in the quarter. Polen Capital Management holds 19,272 shares (INCREASED, +29.2%, a 0.02% portfolio weight, 22.2% of the cohort) and Lee Ainslie - Maverick Capital holds 4,188 shares (DECREASED, -74.1%, a 0.01% portfolio weight, 4.8% of the cohort). All three continuing holders verify row by row against the first quarter, moving from 126,121 shares at March 31 to 86,638 at June 30 (-39,483 shares, -31.3%) — in a quarter the price rose 75.2%. No tracked manager opened a new position, and none exited. All three rows imply exactly $148.16, the June 30 close. 13F figures are as of June 30, 2026; funds have up to 45 days to file, so this is the complete second-quarter picture — a lagging one.
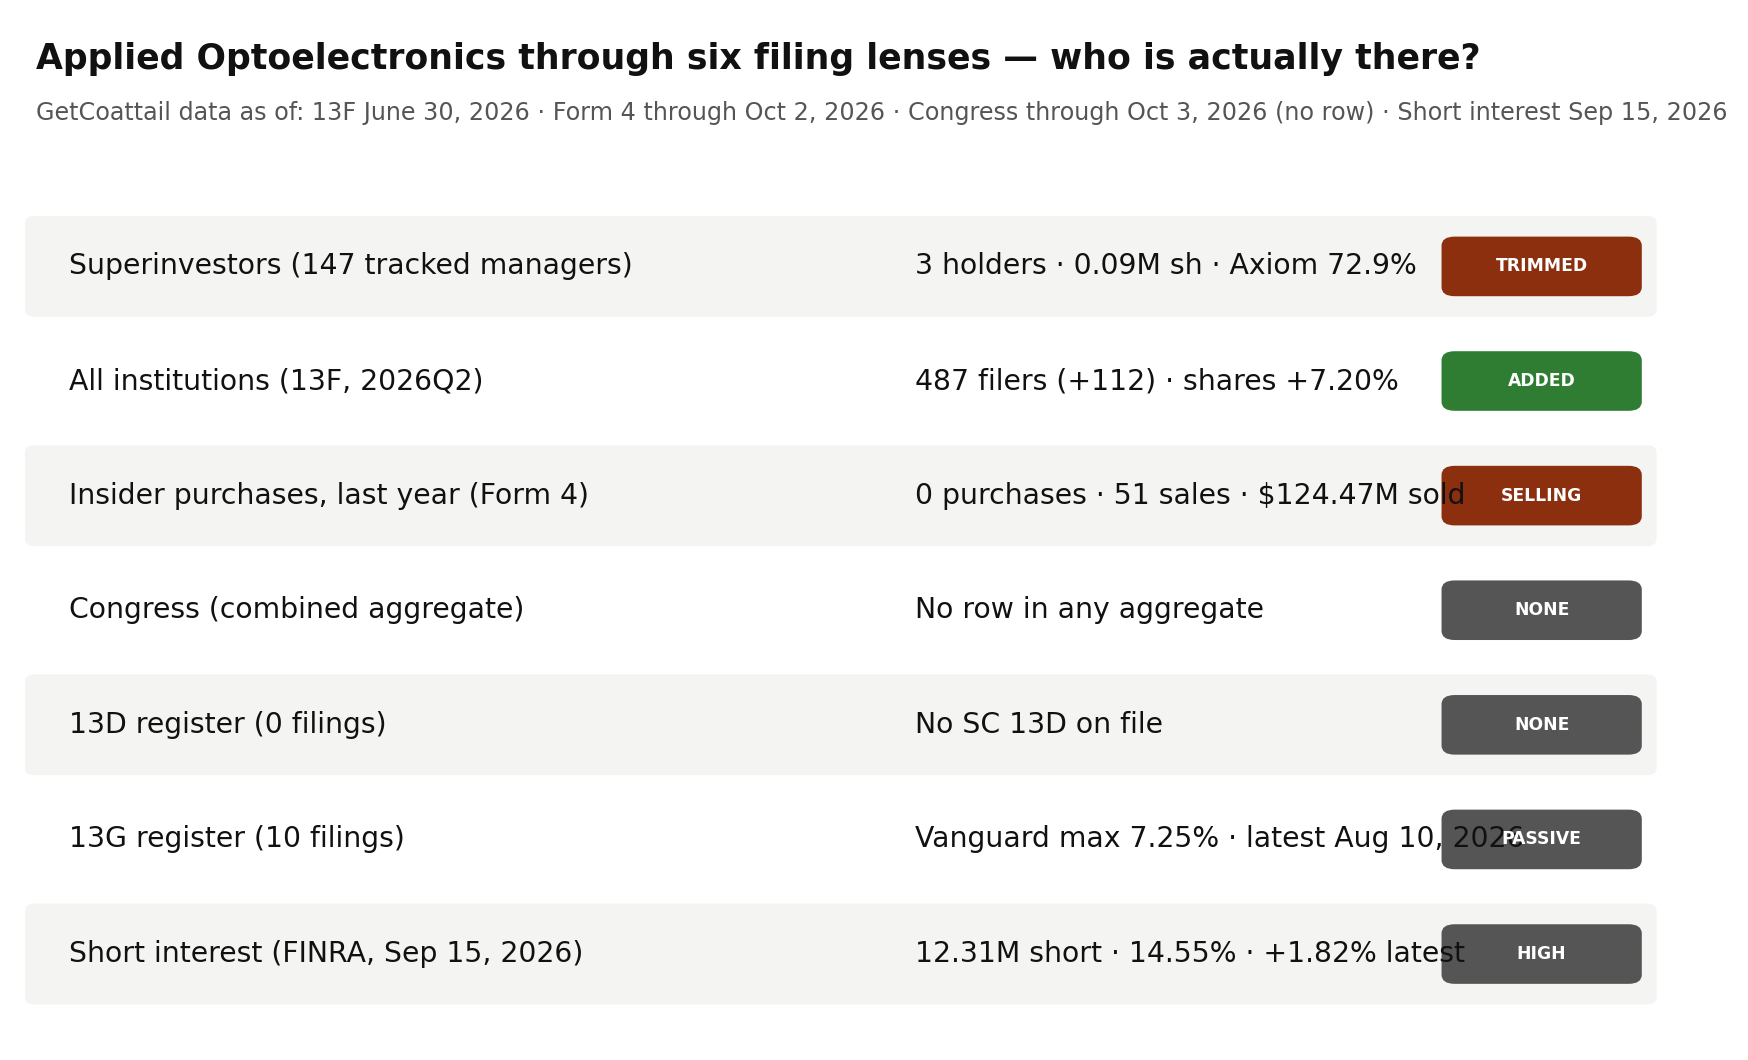
Lens 2 — institutions: 112 more filers, 3.4 million more shares. At June 30, 2026, 487 institutions reported positions, up 112 from 375 at March 31 (+29.87%); 479 of them are long. Reported shares rose 7.20%, from 47,578,101 to 51,004,757, while reported value rose 115.22% to $10,345,817,791, labelled "reported" because the aggregate includes option rows (see methodology). That value implies $202.84 per share against a June 30 close of $148.16, a gap of +36.91% — and the reason this audit headlines filer and share counts rather than the dollar aggregate.
Lens 3 — insiders: no purchase in a year, against 51 sales. The parsed Form 4 record holds 132 filings through October 2, 2026, with 13 open-market purchase transactions in the full record — every one of them older than the one-year window: 77,984 shares for $1,660,956.02, by 4 buyers, 8 of them officer purchases. The one-year window holds no purchase at all, against 51 sales: 913,321 shares for $124,470,897.90, by 10 sellers, 42 of them officer sales, across 77 filings. The last 90 days hold 7 sales (56,172 shares for $6,671,569.32, by 3 sellers, all 7 of them officer sales) across 13 filings, and no purchase. Sales number 65 across the full record (1,008,666 shares for $126,612,697.92, by 10 sellers). Every window prices inside its own traded range: the 90-day sales imply $118.77 per share, inside that window's close range of $76.52 to $154.89; the one-year sales imply $136.28, inside the one-year range; and the full-record purchases imply $21.30 and the full-record sales $125.52, inside the full-period range — so this audit cites dollar totals for all three windows (see methodology).
Lens 4 — Congress: no row in any aggregate. The combined record (as of October 3, 2026), the House aggregate (as of October 3, 2026) and the Senate aggregate (as of October 1, 2026) each carry no row at all for this name. There is no congressional purchase or sale in this lens to date anything by; the lens is blank rather than estimated, and it is the only blank lens in this audit.
Lens 5 — the 5% register: ten filings, all passive, headed by a Vanguard print at 7.25%. Our full parse holds 10 SC 13D/G filings matching the site aggregate exactly — 4 SC 13G and 6 SC 13G/A filings, 6 of them amendments, across 13 reporter names as printed, and no 13D filing at all. The register maximum is 7.25%: The Vanguard Group reports 4,072,660 shares as of June 30, 2025, filed July 29, 2025 as SC 13G/A. The same reporter later filed an SC 13G/A reporting 0 shares (0.0%) as of March 13, 2026, filed March 26, 2026 — a change of reporting entity inside one fund family, recorded exactly as filed. The latest filing is a Jane Street SC 13G/A, filed August 10, 2026 as of June 30, 2026, whose largest reporter row is JANE STREET GROUP, LLC at 1,952,757 shares (2.4%); BlackRock, Inc. reports 4,342,797 shares (5.4%) as of June 30, 2026, filed July 27, 2026, and Marex Securities Products Inc. and Marex Group plc each report 4,486,292 shares (5.6%) as of May 8, 2026. Several of these filings carry multiple related reporters over the same underlying shares, which is why the cross-date reported total of 49,205,626 shares counts reporter rows, not distinct stakes.
The Gap
The narrative arriving with this session is a screener story: third place on a mid-cap watch list, on top of a price that rose 75.2% in the second quarter and 231.6% year to date. The filings describe the register that story lands on after the run. Only 3 of 147 tracked managers hold the name at all, the cohort is one holder deep — Axiom Investors is 72.9% of the stake — and the verified cohort total fell 31.3% in Q2 while the full market's filer count rose by 112 and its share count rose 7.20%. Insiders are one-sided in the recent windows: no purchase in the last year or the last 90 days, against 51 sales worth $124,470,897.90 inside the year and 7 sales worth $6,671,569.32 inside 90 days; the record's 13 purchases all predate October 2025. Congress has no row in any aggregate. The 5% register is ten passive prints whose maximum is dated June 30, 2025, and the borrow stands at 12,307,146 shares — 14.55% of the share count, 14.5% below its November 2025 peak. One plausible reading is that October's argument is happening over a register where the tracked money cut into the rise, the broad market arrived in size, and one share in seven is out on loan — a tape that neither confirms the watch-list story nor argues with it, because its tracked end holds exactly three names.
What Would Change the Picture
Nothing above is a recommendation. It is a record. These filings would change it:
- 1. The 2026Q3 13Fs (filing window closing mid-November 2026). Every holder row here sits on a June 30 period-end, before the stock's fall from its May high fully played out in the position reports; the September 30 filings are the first read on positioning since. Whether Axiom Investors' 63,178-share position — 72.9% of the cohort at a 0.08% portfolio weight — is still there, and whether Polen Capital Management (19,272 shares) builds on the cohort's only increase, decides whether this lens ever reads as more than one name.
- 2. A first insider purchase in over a year. The record's entire buy side is 13 transactions totalling 77,984 shares, all of them before October 2025, against 65 sales. A single purchase inside a one-year window would be a new kind of fact in this lens.
- 3. A first congressional row. The combined, House and Senate aggregates carry no row for this name. Any recorded transaction, in either chamber and in either direction, would be this lens's first fact of any kind.
- 4. A fresh 5% print. The register's newest filing is dated August 10, 2026 (Jane Street entities as of June 30, 2026), and its maximum — The Vanguard Group at 7.25% — is dated June 30, 2025. A new filing moving either figure, or a first 13D, would be this lens's first change of substance in over a year at the top end.
- 5. Short interest through the peak, or back below the June 30 reading. The borrow stands at 12,307,146 shares, up 1.82% in the latest settlement and 14.5% below the series maximum of 14,389,524 shares (November 28, 2025). A reading above that maximum would set a new high for this series; a move back below the June 30, 2026 reading of 10,756,408 would unwind the late-August jump.
Related reading: Three of 147: One Holder Is 86.6% of the Superinvestors' AutoZone Stake. All Three Holders Trimmed in Q2. — Filing Tape #103; Three of 147: One Holder Is 99.8% of the Superinvestors' Teledyne Stake. Its Insiders Have Never Bought a Share. — Filing Tape #102. Applied Optoelectronics' own page: Applied Optoelectronics (AAOI) on GetCoattail.
Methodology and data notes
- As-of & limits: The lenses rest on different clocks, none live: 13F is a June 30, 2026 snapshot published up to 45 days later; Form 4 runs through October 2, 2026; Congress aggregates run through October 3, 2026 (Senate through October 1, 2026); 13D/G through August 10, 2026; short interest through September 15, 2026; the price file ends October 2, 2026. Four limits are specific to this audit. First, the roster expanded before the recent audits — from 85 managers (83 filing) to 149 (147 filing) — so "of 147" counts are not comparable to earlier pieces' "of 83" figures. Second, every 13F figure here predates this month's list appearance; the first post-period 13F picture is the September 30 season. Third, the congressional lens is empty for this name: no aggregate carries a row, so no congressional figure exists to cite. Fourth, this month's session (through October 16, 2026) postdates every lens here; the session is known to this audit only from outside coverage, not from our own files.
- Superinvestor lens: 147 managers in the collection (of a 149-manager roster; 144 at a June 30, 2026 period-end and 3 early filers at September 30, 2026) collected directly from SEC EDGAR Form 13F (managers_13f collection, regenerated October 15, 2026 for the expanded roster); Applied Optoelectronics positions are counted on the single CUSIP 03823U102 only, long rows only, and there are no option rows for this name in the collection. Three distinct managers hold long positions, all at June 30, 2026, totalling 86,638 shares worth $12,836,286 — no period mix. The direction count is two DECREASED and one INCREASED: Axiom Investors (-33.5%), Lee Ainslie - Maverick Capital (-74.1%) and Polen Capital Management (+29.2%). Axiom Investors' share is 72.9% = 63,178 / 86,638; Polen Capital Management's share is 22.2% = 19,272 / 86,638, and Lee Ainslie - Maverick Capital's share is 4.8% = 4,188 / 86,638. All three continuing holders verify row by row against the first quarter under the rule used in the previous audits — each continuing holder's first-quarter row accepted only when it sits under the same filing-agent prefix as the manager's second-quarter accession and its implied shares-change reproduces the EDGAR shares-change label at one decimal place — so the verified continuing total is 126,121 shares at March 31 moving to 86,638 at June 30 (-31.3%), with no unverified continuing holder and no new holder. First-quarter rows: Axiom Investors 95,015; Lee Ainslie - Maverick Capital 16,193; Polen Capital Management 14,913. No tracked manager exited in the second quarter: the collection's exited list carries no Applied Optoelectronics row, and the pipeline register's first-quarter count for this name is the same three managers. Implied per-share values: all three rows imply exactly $148.16, the June 30, 2026 close. The pipeline register totals match the collection for this name in both quarters (3 rows and 86,638 shares in the second quarter; 3 rows and 126,121 shares in the first).
- Full-market lens: SEC Form 13F Data Sets full-market aggregation. The primary table is the full13f collection's by-ticker file (holders = distinct filers reporting the ticker's CUSIP; 479 reported long positions out of 487 filers). Applied Optoelectronics carries a single CUSIP in this aggregation (03823U102), and the backfill fixtures' by-CUSIP row for it matches the by-ticker row on every field — holders, long holders, shares, reported value, prior holders and prior reported value — exactly. The by-ticker file's entered/exited fields (463 and 351, a net of +112 that matches the change in holder count) are gross flows, so this audit headlines the net change. Reported-value caution: the aggregate value ($10,345,817,791 over 51,004,757 shares) implies $202.84 per share against a June 30, 2026 close of $148.16 in our price file, a gap of +36.91% — printed here as found. The aggregate sums the VALUE of every information-table row — including put and call option rows — while the share count covers long common-stock rows only, so we headline filer and share counts and label dollar values "reported."
- Insider lens: full-parse Form 4 aggregation (agg_by_ticker), record as of October 2, 2026 (132 filings). Sale and purchase counts are transaction-code counts (S and P) in non-derivative rows; grants and exercises are not counted as purchases, and one filing can contain many transaction rows. Purchase transactions total 13 across the record — 0 in the 90-day window (July 5 to October 2, 2026), 0 in the one-year window (October 3, 2025 to October 2, 2026) and 13 in the full record, with 4 buyers in the full window and 8 officer purchase transactions. Sale transactions total 65 across the record (1,008,666 shares, $126,612,697.92, 10 sellers, 55 officer sale transactions), of which the one-year window holds 51 (913,321 shares, $124,470,897.90, 10 sellers, 42 officer sale transactions) and the 90-day window holds 7 (56,172 shares, $6,671,569.32, 3 sellers, 7 officer sale transactions) across 13 filings. The site's insider aggregate (as of October 17, 2026, a 90-day window) carries this name, but its window is anchored to a later date than the full parse's, so the two 90-day windows do not cover the same days: the site row prints 0 purchases, 6 sales, 3 sellers and $6,183,209.32, against the full parse's 7 sales and $6,671,569.32 for its own window — a one-transaction, $488,360.00 difference attributable to the shifted window, recorded here rather than reconciled away. Window price checks on our price file: the 90-day sales imply $118.77 per share, inside that window's close range ($76.52 to $154.89); the one-year sales imply $136.28, inside the one-year range ($19.49 to $223.10); and the full-record purchases imply $21.30 and the full-record sales $125.52, inside the price file's full-period close range ($1.50 to $223.10) — so dollar totals are cited for all three windows.
- 13D/G lens: full-parse SC 13D/G parsed filings (10 filings matching issuer CIK 1158114 on CUSIP 03823U102: 4 SC 13G and 6 SC 13G/A, 6 of them amendments, no SC 13D), filings through August 10, 2026. The site aggregation carries this name under a ticker-keyed row; that row (10 filings, 0 D-filings, 10 G-filings, 6 amendments, 13 reporters, latest date August 10, 2026, maximum 7.25%, total reported 49,205,626 shares) matches the parsed filings on filings, form mix, amendments, latest date, maximum and the cross-date reported total. The total sums reporter rows across filings and dates, and several filings name multiple related reporters over the same underlying shares (the D. E. Shaw and Jane Street filings in particular), so it is a filing-volume total, not a stake. The rows are reported as filed, under the names exactly as they appear: The Vanguard Group printing 4,072,660 shares at 7.25% as of June 30, 2025, filed July 29, 2025 as SC 13G/A (the register maximum); The Vanguard Group printing 0 shares at 0.0% as of March 13, 2026, filed March 26, 2026 as SC 13G/A; BlackRock, Inc. printing 4,342,797 shares at 5.4% as of June 30, 2026, filed July 27, 2026 as SC 13G/A; Marex Securities Products Inc. and Marex Group plc each printing 4,486,292 shares at 5.6% as of May 8, 2026, filed May 13, 2026 as SC 13G; and the Jane Street entities' SC 13G/A filed August 10, 2026 as of June 30, 2026, whose largest reporter row is JANE STREET GROUP, LLC at 1,952,757 shares (2.4%). The parsed coverage for this issuer holds these 10 filings; a 5% holder that has not filed in the covered window would not appear here.
- Congress lens: Senate PTR archive and House PTR archive as maintained on this site. The combined record (as of October 3, 2026), the House aggregate (as of October 3, 2026) and the Senate aggregate (as of October 1, 2026) each carry no row for this name. No figure is printed for this lens because there is no aggregate row to print; the absence is recorded here and in the lens table rather than filled with a zero, since a missing row and a row of zeros are different statements about the underlying archives.
- Short interest lens: FINRA Equity Short Interest files (biweekly settlement dates), collected directly from FINRA's public distribution. The published series covers all 137 settlements under the symbol, every one an Applied Optoelectronics row, from January 15, 2021 (3,820,726 shares) to September 15, 2026. The latest reading is 12,307,146 shares on September 15, 2026, up 1.82% from the prior settlement (12,086,618 on August 31, 2026), at 1.97 days to cover. The series maximum is 14,389,524 shares on November 28, 2025, so the latest reading sits 14.5% below it; the series minimum is 3,003,619 shares on April 28, 2023. The late-August step is the recent feature: 10,756,408 (June 30), 9,936,995 (July 15), 10,434,298 (July 31), 10,421,985 (August 14), 12,086,618 (August 31) and 12,307,146 (September 15). FINRA publishes each settlement about two weeks after the fact, so the October price action is not yet in this series. The share-count ratio (14.55%) uses the fundamentals file's shares-outstanding figure below.
- Fundamentals note: our fundamentals collection carries Applied Optoelectronics' revenue of $455,715,000, net income of -$38,228,000 and assets of $1,168,423,000, each labelled fiscal 2025 in the file. The file is marked ok for this name, with no missing fields: shares outstanding of 84,569,237 (sourced in the file to the shares-outstanding count as of August 3, 2026) and a file-computed market value of $11,007,532,197.62. The file does not flag the issuer as a foreign private issuer, and it carries SIC 3674, Semiconductors & Related Devices, and a Nasdaq listing. The file's price for the name is $130.16 as of October 6, 2026; our daily-close file ends October 2, 2026 at $115.59, and we keep the two files' figures separate rather than blending them.
- Prices: our own daily-close file for Applied Optoelectronics through October 2, 2026 ($115.59 close, +231.6% year to date on that file; the 252-session closing high is $223.10 on May 13, 2026, so the last close sits 48.2% below it; the 252-session closing low is $19.49 on November 20, 2025, so the last close sits 493.1% above it; closes of $84.59 at March 31, 2026 and $148.16 at June 30, 2026, a second-quarter change of +75.2%; change from June 30 to October 2 of -22.0%; change from the September 30, 2025 close of $25.93 of +345.8%; the December 31, 2025 close is $34.86). The series in our price file begins June 1, 2021 at $8.54 and holds 1,342 rows; the file's full-period close range is $1.50 to $223.10.
- Market context sources: MarketBeat's "Best Mid Cap Stocks To Watch Today" list for October 16, 2026, as carried by Ticker Report, which placed Applied Optoelectronics third, behind an index ETF (SQQQ) and Varonis Systems (VRNS), a name our fundamentals file does not carry a record for. Figures we could not confirm were left out; the external item above is reported speech from that outlet, not a GetCoattail measurement.
- Applied Optoelectronics is in the GetCoattail stock-page universe: Applied Optoelectronics (AAOI) stock page. Series data: aaoi_lens_data.csv · aaoi_short_interest_series.csv. Earlier audits: AutoZone · Teledyne Technologies.
Past patterns are not a promise of future results. For education only — not investment advice.
This article describes public filings as of the dates stated. It is not investment advice and makes no recommendation. Filings lag reality: 13F positions are as of June 30, 2026, and later trading is not yet public.
Revision history
- v1.0 — October 17, 2026: first publication.