GetCoattail Research — The Filing Tape #173. Analog Devices (ADI) is one of the most-searched stocks on Zacks.com as of October 23, 2026 — up 0.8% over the past month against a −1.2% S&P 500, per the Zacks note. The filings show 16 of 147 tracked funds holding 6,341,679 shares of Analog Devices common stock, $2.52 billion reported, as of June 30, 2026: the verified continuing cohort cut 29.5% in Q2 while the full 13F market added 17.54% more shares; insiders recorded zero open-market buys in our 141-filing parsed record; three members of Congress disclosed small trades; the passive 13G register's largest current holder is Vanguard Capital Management at 7.47% after The Vanguard Group dropped below 5%; and short interest is down 28.3% from the June settlement, at 1.78% of shares outstanding.
① The Hype
Analog Devices is not a story stock in the way this series usually means it. It is a $200-billion analog semiconductor maker — the kind of name that trends when the market is working through a tech sell-off rather than chasing one. On October 23, 2026, Zacks.com noted that ADI "has been one of the most searched-for stocks on Zacks.com lately," alongside a modest past-month return of +0.8% against a −1.2% S&P 500 composite, while its industry bucket (Zacks Semiconductor — Analog and Mixed) lost 5.5%.
The price context around that note is a stock that ran hard and then cooled. Our price file ends October 2, 2026, with ADI at $417.15 — up 23.9% in Q2 (from $320.58), up 52.4% year to date, up 72.6% from a year earlier. The daily-refreshed close is fresher than our file: $385.76 on October 22, 2026 — 13.5% below the 52-week high of $445.91. So the search spike sits on a pullback, not a breakout.
Our file cannot verify the Zacks note's price figures themselves — they are external, stated as such, and the link is above. What the files can do is check whether the searchers' interest is matched by the filings.
② The Tape
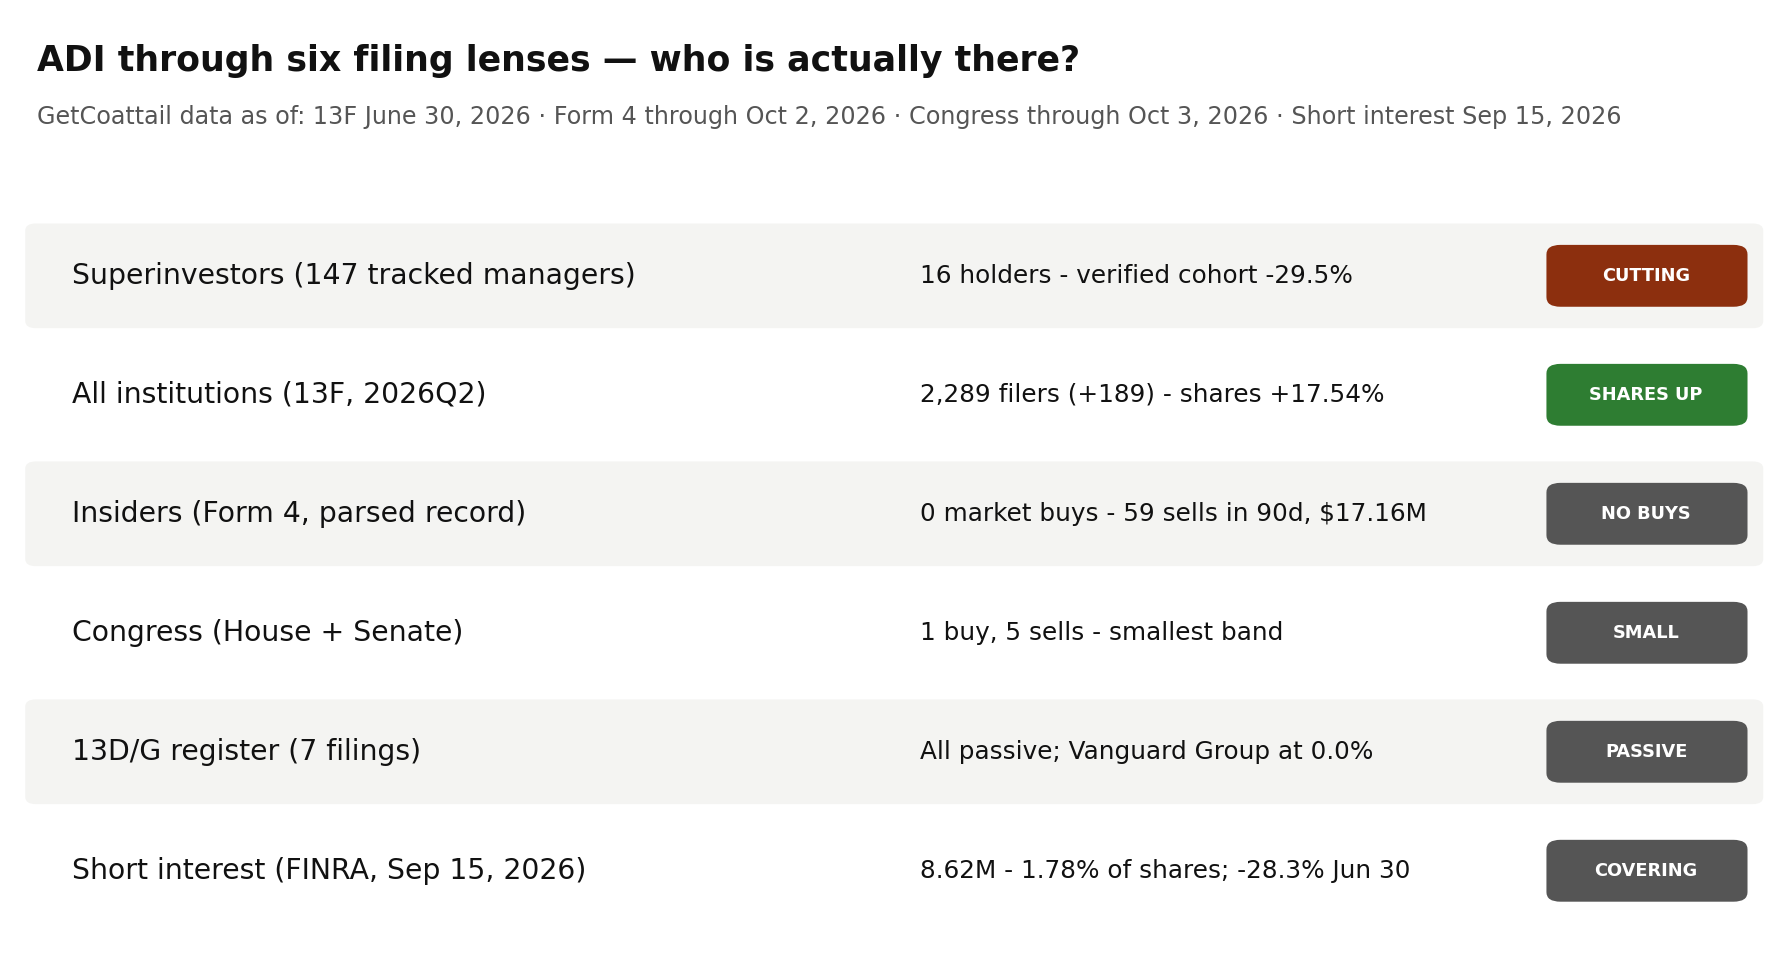
| Lens | As of | What the filings show | Direction vs prior period |
|---|---|---|---|
| Superinvestors (13F) | Jun 30, 2026 | 16 of 147 tracked funds hold 6,341,679 shares, $2.52B reported | Verified continuing cohort −29.5% |
| All institutions (13F) | Jun 30, 2026 | 2,289 filers, 438,163,853 shares | +189 filers; shares +17.54% |
| Insiders (Form 4) | Through Oct 2, 2026 | 0 open-market buys in the record; 59 sells in 90 days ($17.16M) | Selling, never buying |
| Congress | Through Oct 3, 2026 | 1 buy, 5 sells — all in the smallest reported band | Small prints |
| 13D / 13G | Through Apr 29, 2026 | All passive; Vanguard Group below 5%; Vanguard Capital 7.47% | Passive only |
| Short interest (FINRA) | Sep 15, 2026 | 8,621,427 shares; 1.78% of shares outstanding | −28.3% from Jun 30 settlement |
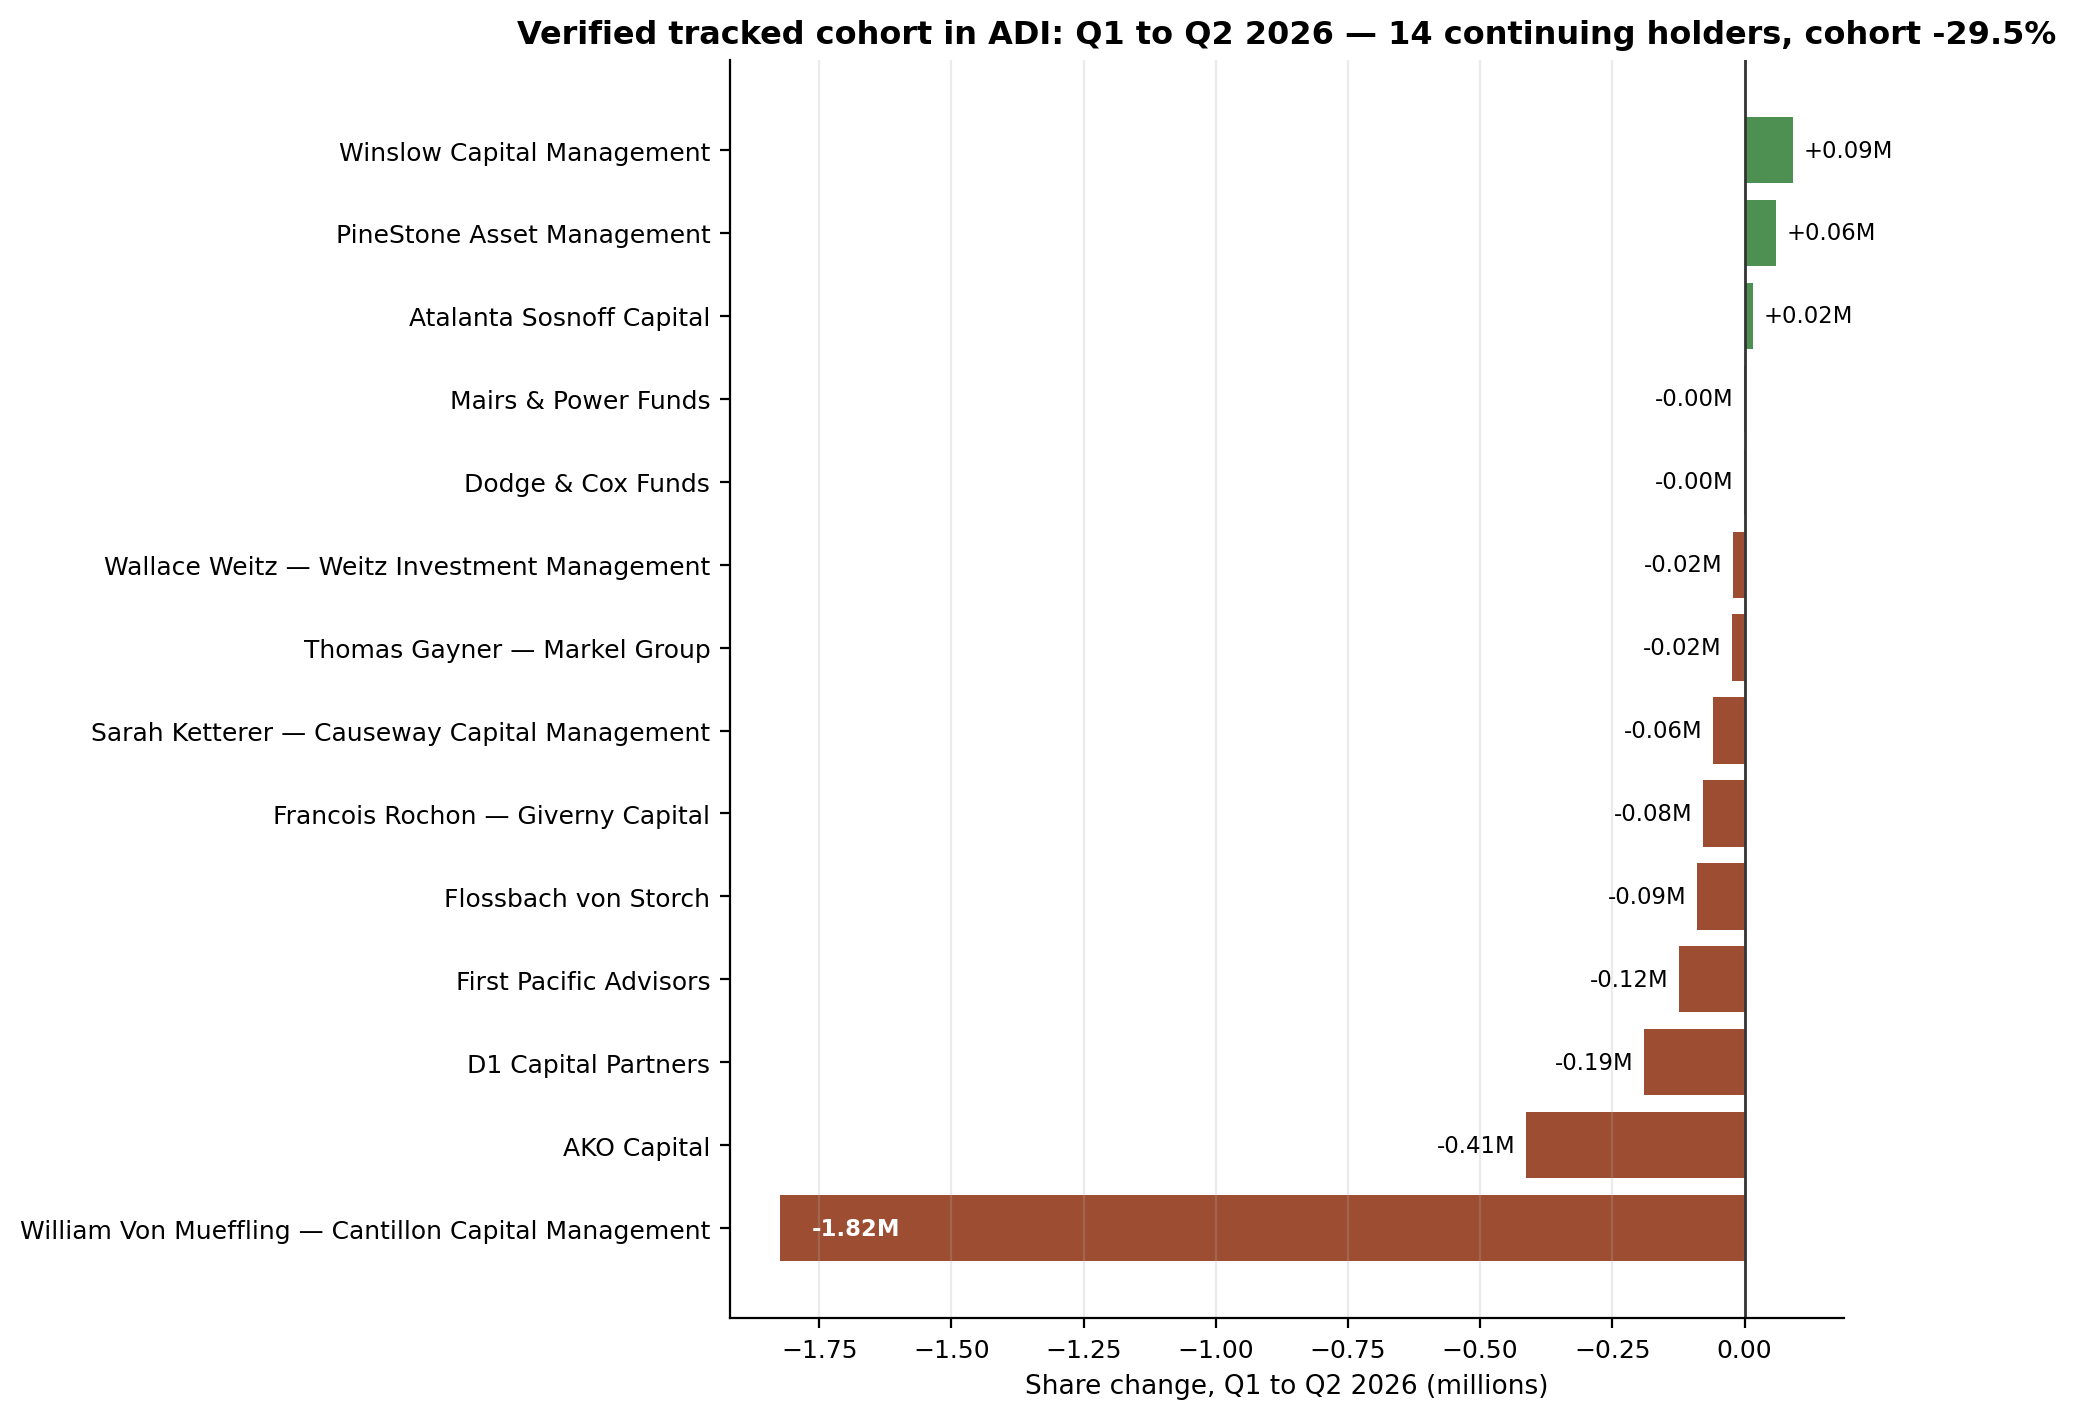
Superinvestors. Sixteen of 147 tracked funds held ADI common stock at June 30, 2026: 6,341,679 shares, $2.52 billion reported — 1.447% of all 13F-reported ADI shares. The direction is the story: 11 of the 16 cut, 3 added, 2 are new. The verified continuing cohort (14 funds, paired by unique CUSIP-overlap accession matches) fell 29.5% in Q2 — from 8,994,218 shares to 6,338,363, a reduction of 2,655,855 shares. A stricter pairing method (13 funds, requiring the label recompute to match) gives −28.2%: same direction, same magnitude. The cuts ran deep: Cantillon Capital Management −95.4% (1,911,491 to 88,014), D1 Capital Partners −65.1% (292,444 to 102,040), Giverny Capital −45.4% (171,052 to 93,310), AKO Capital −40.1% (1,029,523 to 616,881). The increases were smaller: Atalanta Sosnoff +10.4%, Winslow Capital +10.2%, PineStone Asset Management +7.2%. First Pacific Advisors remains the largest tracked holder at 1,598,506 shares (25.2% of the cohort) — but even it cut 7.2%. The two new lines are token: Maverick Capital 2,704 shares, Brave Warrior Advisors 612 shares. First Eagle exited its 48 shares. The cohort's implied price of $397.17 lands exactly on the June 30 close — clean arithmetic, a shrunken register.
All institutions. The broad 13F market moved the other way. Filers grew to 2,289 (+189, +9.0%), reported shares grew 17.54% to 438,163,853 — a net add of 65.4 million shares — and reported value rose 50.82% to $170.27 billion (value includes option rows, so shares are the cleaner signal). The single-CUSIP fixture check matches exactly. While the tracked cohort's verified continuing line fell 29.5%, the full market's register added 17.5% more shares — a clean divergence between the smart-money cohort and the institutional average.
Insiders. The parsed record is a one-way ledger: 141 filings from January 3, 2025 to September 23, 2026, zero open-market buys, 278 sells totaling 477,064.79 shares and $141.63 million from 10 distinct sellers. Over the last year, 201 sells of 289,797.79 shares ($99.39 million) from 9 sellers. In the last 90 days: 18 filings, 59 sells of 46,179 shares ($17.16 million) from 4 sellers, with 6 officer sells and zero officer buys. Implied sale prices pass their price gates in every window (w90 $371.53, w1y $342.97, full-record $296.87 — each inside the price file's range for the same window). Our site's insider aggregate shows the same direction (zero buys) but counts fewer 90-day sells (36 vs our 59; $11.79M vs $17.16M) — an aggregation-method difference, stated here so both numbers are on the record.
Congress. Small prints, both sides of the tape. The combined aggregate (through October 3, 2026) records 1 buy and 5 sells. The member file names three: Rep. Josh Gottheimer (D) bought once, in the $1,001–$15,000 band, on May 19, 2026; Rep. Thomas Kean (R) sold twice through June 30; Rep. Richard McCormick (R) sold twice through July 30. The single Senate sell is unattributed in the members file — an attribution gap in our data, though the totals reconcile. Every disclosed amount sits in the lowest reporting band.
13D / 13G. Seven filings, three reporters, four amendments — all passive. The register maximum is The Vanguard Group's SC 13G/A at 10.0% (49,618,676 shares, filed March 6, 2026, as of February 28, 2025). Then the interesting row: Vanguard Group filed another SC 13G/A on March 26, 2026 — at 0.0 shares, 0.0% — dropping below the 5% reporting threshold. The largest current print is Vanguard Capital Management's SC 13G at 7.47% (36,512,048 shares, filed April 29, 2026, as of March 31, 2026). JPMorgan Chase cycles between 4.3% and 5.0% passive across four filings. The aggregate matches the parsed filings exactly. There is no activist (13D-family) row in the register.
Short interest. Shorts covered steadily into September. From the June 30, 2026 settlement (12,030,161 shares), the series fell to 8,621,427 shares at September 15 — −28.3%, with 2.67 days to cover and 1.78% of shares outstanding. That is +3.2% versus a year ago (8,350,588), and the 2021 peak of 42.4 million shares is 79.7% above the current print — the bears have been leaving for years, and kept leaving through Q3.
③ The Gap
The search story and the filing story disagree on where the conviction sits. Zacks' searchers are arriving after a stock ran 23.9% in Q2 and then faded 13.5% off its high. The filings show the tracked money fading with it — the verified cohort cut 29.5% in the same quarter the price was rising. One plausible reading is that the Q2 rally ran ahead of the filings: the cohort took the strength as an exit window while the broad register kept accumulating. But the record shows positions and quarter-ends, not intent or intra-quarter timing — so that reading stays marked as a reading.
The second half of the gap is sharper. Across the same climb that took the stock 72.6% higher year over year, insiders sold: 278 sells, 477,064.79 shares, $141.63 million across our parsed record, with zero open-market buys in 141 filings. Not a single officer purchase. The congressional record adds one small buy and five small sells — all in the lowest reporting band, closer to noise than signal. The 13G register's most telling row is the one at zero: Vanguard Group's drop below 5%, reported on March 26, 2026, leaving Vanguard Capital Management's 7.47% as the largest current passive print.
If anyone was selling into the Q2 strength, the filings name the four managers that cut hardest: Cantillon's 95.4% cut alone removed 1,823,477 shares, D1's 65.1% cut another 190,404, Giverny's 45.4% another 77,742, AKO's 40.1% another 412,642. That is the cut side. The add side — the full market's +17.54% shares and +9.0% filers — sits outside the tracked 147, in the institutional average. The tape does not say who is right; it says the smart-money cohort and the full market moved in opposite directions in Q2, while insiders never bought and shorts kept covering.
④ What Would Change the Picture
Nothing above is a recommendation. It is a record. The next filing cycles will rewrite that record one row at a time — here is what would change the picture, all checkable in future filings:
- 1. The Q3 13F season (deadline November 16, 2026). Does the tracked cohort's verified line keep shrinking past 6.34 million shares, or do the cutters — Cantillon, D1, Giverny, AKO — reappear as buyers? Do the token new lines (Maverick's 2,704, Brave Warrior's 612) grow into real positions? Does any tracked name cross back above the Q1 level?
- 2. A genuine insider buy. Any open-market purchase in a future Form 4 would be the first in our parsed record — against 278 sells and $141.63 million of selling across it.
- 3. Short interest turning. Shorts fell 28.3% from the June settlement to September 15. A rebuild through the October settlements would signal the bear case is rearming into the pullback; continued covering confirms the unwind.
- 4. A new 13D. The register is entirely passive. A fresh activist-schedule filing would change its character from index-heavy to contested.
- 5. Vanguard's footprint. The Vanguard Group sits below 5% as of March 2026 while Vanguard Capital Management holds 7.47%. The next 13G cycle shows whether that split persists or consolidates.
⑤ As-of & Limits
| Lens | As of |
|---|---|
| Superinvestors (13F) | Jun 30, 2026 (13F figures are as of the quarter-end; funds have up to 45 days after quarter-end to file, so this is the most recent complete picture — and it is always a lagging one) |
| All institutions (13F) | Jun 30, 2026 (same 45-day lag; reported value includes option rows) |
| Insiders (Form 4) | Through Oct 2, 2026 (parsed record span Jan 3, 2025 – Sep 23, 2026; 141 filings by issuer CIK 6281) |
| Congress | Combined & House through Oct 3, 2026; Senate through Oct 1, 2026 (one Senate sell unattributed in the members file) |
| 13D / 13G | Parsed filings through Apr 29, 2026 |
| Short interest (FINRA) | Sep 15, 2026 settlement (137 settlements, symbol ADI only) |
| Prices | File through Oct 2, 2026 ($417.15); fresh close $385.76 (Oct 22, 2026) from chart_stats.json daily refresh |
| Fundamentals | Market cap $203.78B (price as of Oct 6, 2026); FY2025 revenue $11.02B (us-gaap concept tag disclosed), net income $2.27B, assets $47.99B, 484,565,465 shares (Aug 1, 2026) |
Methodology and data notes
- As-of & limits: The lenses rest on different clocks, none live: 13F is a June 30, 2026 snapshot published up to 45 days later; Form 4 windows run through October 2, 2026; Congress aggregates run through October 3, 2026 (Senate through October 1, 2026); 13D/G through April 29, 2026; short-interest settlements through September 15, 2026; the price file ends October 2, 2026 while the daily-refreshed close quoted ($385.76) is from October 22, 2026. Limits specific to this audit. First, the tracked cohort is 16 managers: the largest, First Pacific Advisors at 25.2% of the cohort, is a 7.85% portfolio weight; the two new lines are token positions (Maverick 2,704 shares, Brave Warrior 612 shares). Second, ADI common stock carries a single CUSIP (032654105), and the full-market by-CUSIP row matches the by-ticker aggregate on every field — holders, long holders, shares, reported value, prior holders and prior reported value — so no CUSIP blending question arises. Third, the tracked change figures are verified, not taken on trust: 14 continuing holders were paired by unique CUSIP-overlap accession matches (method 2), and a stricter accession-prefix plus label-recompute pass (method 1) verifies 13 of them — the two methods give −29.5% and −28.2% respectively, same direction and magnitude. AKO's Q1 pipeline value_usd (327,532) is a corrupt unit and was excluded from value stats; its shares recompute (−40.1%) matches the collector label exactly. The NEW labels were verified against the Q1 register (no Q1 rows under those managers); First Eagle's exit is 48 shares. No September early filer holds this name. The registers reconcile with no remainder. Fourth, the June cohort's implied price is $397.17 against the June 30 close of $397.17 (+0.00%). Fifth, the full-market aggregate implies $388.59 against the $397.17 close (−2.2%): the aggregate is a reported sum that includes option rows, so its implied price need not equal the close; this audit uses filer counts and share counts as this lens's primary measures and reports the value as reported only. Sixth, the insider lens rests on a single aggregate bucket — this issuer's filings sit under one symbol spelling, "ADI", with no case split — cross-checked against a row-level scan of all 141 parsed filings for the issuer (CIK 6281): filing counts, transaction counts, share counts, officer-row counts and values reproduce exactly in every window, and no accession appears under more than one symbol spelling. There are zero P-coded transactions in the entire parsed record; the implied sale prices pass their price gates (the 90-day implied sale price of $371.53, the one-year implied sale price of $342.97 and the full-record implied sale price of $296.87 each sit inside their filing-window close ranges). Form 4 windows in this audit are filing-date windows. Our site's insider aggregate carries an ADI row (checked October 24, 2026) but does NOT match the 90-day window exactly: 0 buys, 36 sellTx, $11,790,817.32 against our 0 buys, 59 sellTx, $17,156,758.20 — an aggregation-method difference; both numbers are on the record and the direction is identical. Seventh, the congressional lens is reported across four files: the combined aggregate (1 buy, 5 sells), the House aggregate (1 buy, 4 sells), the Senate aggregate (0 buys, 1 sell) and the member file — which names three members (Gottheimer 1 buy May 19, 2026; Kean 2 sells; McCormick 2 sells), leaving the single Senate sell unattributed; the totals reconcile and every amount sits in the $1,001–$15,000 band. Eighth, the 5% register holds seven filings from three reporters with four amendments, all passive: The Vanguard Group's SC 13G/A (filed March 6, 2026) prints 49,618,676 shares at 10.0% as of February 28, 2025 — the register maximum; the same reporter's SC 13G/A (filed March 26, 2026) prints 0 shares at 0.0% as of March 13, 2026 — below the reporting threshold; Vanguard Capital Management's SC 13G (filed April 29, 2026) prints 36,512,048 shares at 7.47% as of March 31, 2026 — the largest current print; JPMorgan Chase & Co.'s SC 13G (filed February 10, 2025) prints at 5.0%, its SC 13G/A (filed March 6, 2025) at 4.3%, its SC 13G (filed July 30, 2025) at 5.0%, and its SC 13G/A (filed August 5, 2025) at 4.4%. The parsed totals match the aggregate exactly (filings, max percent, total shares reported, latest date). Ninth, the short-interest series holds 137 settlements, so its maximum and minimum describe that span only. Within it, the series carries one under-half discontinuity on consecutive settlements — Aug 13, 2021 (41,313,653) → Aug 31, 2021 (12,488,061), ratio 0.302 — with no split flag on either row; all other consecutive steps sit within [0.5, 2.0]. The series reads 12,030,161 (Jun 30, 2026) → 10,464,738 (Jul 15) → 9,768,175 (Jul 31) → 8,403,888 (Aug 14) → 8,750,314 (Aug 31) → 8,621,427 (Sep 15, −28.3% from the June settlement). The 1.78% short-interest figure uses 484,565,465 shares from our fundamentals file (a measured period-end count), not a float estimate. Our price file records no split factor for this name. The fundamentals record is status ok: FY2025 revenue $11,019,707,000 (stored under the us-gaap concept tag RevenueFromContractWithCustomerExcludingAssessedTax — the tag is disclosed because it differs from the usual sales concept) and net income $2,267,342,000, total assets $47,992,712,000, 484,565,465 shares outstanding as of August 1, 2026, market cap $203,784,000,390.64 at the October 6, 2026 price. The market figures in The Hype — the Zacks search note, its +0.8% past-month figure, the industry figure — are the outlet's published figures, cited as such, not blended into file-based calculations; our price file cannot confirm or refute post-October-2 price levels, which is why the October 22 close is separately sourced from the daily-refreshed chart statistics.
- Market context sources: Zacks.com, October 23, 2026 ("Is Trending Stock Analog Devices, Inc. (ADI) a Buy Now?": ADI "one of the most searched-for stocks on Zacks.com lately"; past month +0.8% vs Zacks S&P 500 composite −1.2%; Zacks Semiconductor — Analog and Mixed industry −5.5%).
- ADI is in the GetCoattail stock-page universe: ADI (ADI) stock page. Tracked manager pages: First Pacific Advisors · Thomas Gayner — Markel Group · Winslow Capital Management · AKO Capital · D1 Capital Partners. Series data: adi_lens_data.csv · adi_short_interest_series.csv. Earlier audits: RingCentral · TJX · Dollar General.
This article describes filings and reported positions — it is not investment advice. Past patterns are not a promise of future results. For education only — not investment advice.
Revision history: v1.0 — October 24, 2026