GetCoattail Research — The Filing Tape #85. Applied Materials fell 7.7% in the session of its investor day and kept falling with the chip complex, and the filings describe the first audit on our expanded 147-manager roster: a cohort in which 16 of 19 continuing holders cut in the quarter the price rose 111.5% and none raised, a full market that added 106,613,289 shares, an insider record with exactly two purchases — 50,000 shares for $6,865,081.79, both over a year old — against $180,455,904.65 of sales, a House-only congressional record that bought four times, an all-passive 5% register and a borrow down 37.4% from its peak.
The Hype
Applied Materials makes the deposition and etch equipment the chip industry expands with, and it walked into its investor day with the stock up 79% year to date. The day went the other way: the shares fell 7.7% to $459.20 in the October 13 session, on pace for a sixth straight loss, after the chief executive declined to give a wafer-fab-equipment forecast and the 2030 targets arrived without near-term detail. October 14 brought another leg down: the semiconductor ETF fell more than 4% toward a seventh straight losing session, September CPI printed +3.7% year over year against +3.6% expected, the S&P 500 fell 1.11% and the Nasdaq 100 fell 2.02%. Across the six-session slide ARM fell nearly 16%, Applied Materials about 14% and Intel 11%; a session earlier it had been the top percentage loser in both the S&P 500 and the Nasdaq 100, down more than 6%. At that close the stock sat about 36% below the record close of $723 recorded on June 30 — a high our own price file records as well. The filings below describe who held it before this slide, through a quarter in which the price rose 111.5%.
The Tape
For Applied Materials — the eighty-fifth Filing Tape audit, the first on the expanded roster described in the notes — the tape shows a 25-name cohort whose largest holder is 36.9% of the position and in which no continuing holder raised in Q2, a full market that added 106,613,289 shares in the same quarter, an insider record with two purchases in its entire parsed history against 47 sales, a congressional record that sits entirely in the House and leans the other way — four purchases, one sale — a 5% register of two filings carrying only Vanguard names, and a borrow down 37.4% from its peak.
| Lens | As of | What the filings show | Direction vs prior period |
|---|---|---|---|
| Superinvestors (13F) | Jun 30, 2026 | 25 long holders; 16,522,300 shares; $11,846,648,877 | Of 19 continuing holders: 16 decreased, 3 unchanged, 0 increased; 6 new; no cohort total published (see notes) |
| All institutions (13F) | Jun 30, 2026 | 3,506 filers; 655,304,783 shares | Filers +593; shares +19.43% |
| Insiders (Form 4) | Oct 2, 2026 | 2 purchases in the full parsed record; last 90 days: 2 sales | No purchase in the last year; 47 sales in the full record |
| Congress | Oct 3, 2026 | 4 purchases and 1 sale, all in the House file; members field 3; Senate file has no row | Last purchase Aug 6, 2026 |
| 13D/G | Apr 29, 2026 | 2 parsed filings (all SC 13G-family, 0 SC 13D-family); register maximum 7.49% (Vanguard Capital Management) | Latest filing reports 7.49% as of Mar 31, 2026 |
| Short interest (FINRA) | Sep 15, 2026 | 14,108,387 shares; 1.78% of shares outstanding | Down 37.4% from the series maximum; down 29.2% year over year |
Lens 1 — the superinvestors: 25 holders, one of them 36.9% of the stake, and not one raise. We now track 149 large, mostly long-only managers whose 13F portfolios we collect directly from SEC EDGAR — 147 filed for the second quarter (see the roster note below). As of June 30, 2026, 25 held Applied Materials long, totalling 16,522,300 shares worth $11,846,648,877, with no option rows and no exit-list row. Sanders Capital is the largest holder, with 6,094,372 shares worth $4,406,230,956 — 36.9% of the cohort — at a 4.41% weight, labelled DECREASED (-1.3%). Coatue Management holds 4,213,483 shares worth $3,046,348,209 — 25.5% of the cohort — also DECREASED (-19.7%). The labels are one-way: of the 19 continuing holders, 16 are labelled DECREASED, 3 UNCHANGED, and none INCREASED — the deepest cuts include Davis Advisors (-91.4%), Cantillon Capital (-96.7%) and Maverick Capital (-99.7%) — while six managers opened new positions, Lone Pine Capital's 1,207,737 shares the largest. 13F figures are as of June 30, 2026; funds have up to 45 days to file, so this picture is complete — and always lagging.
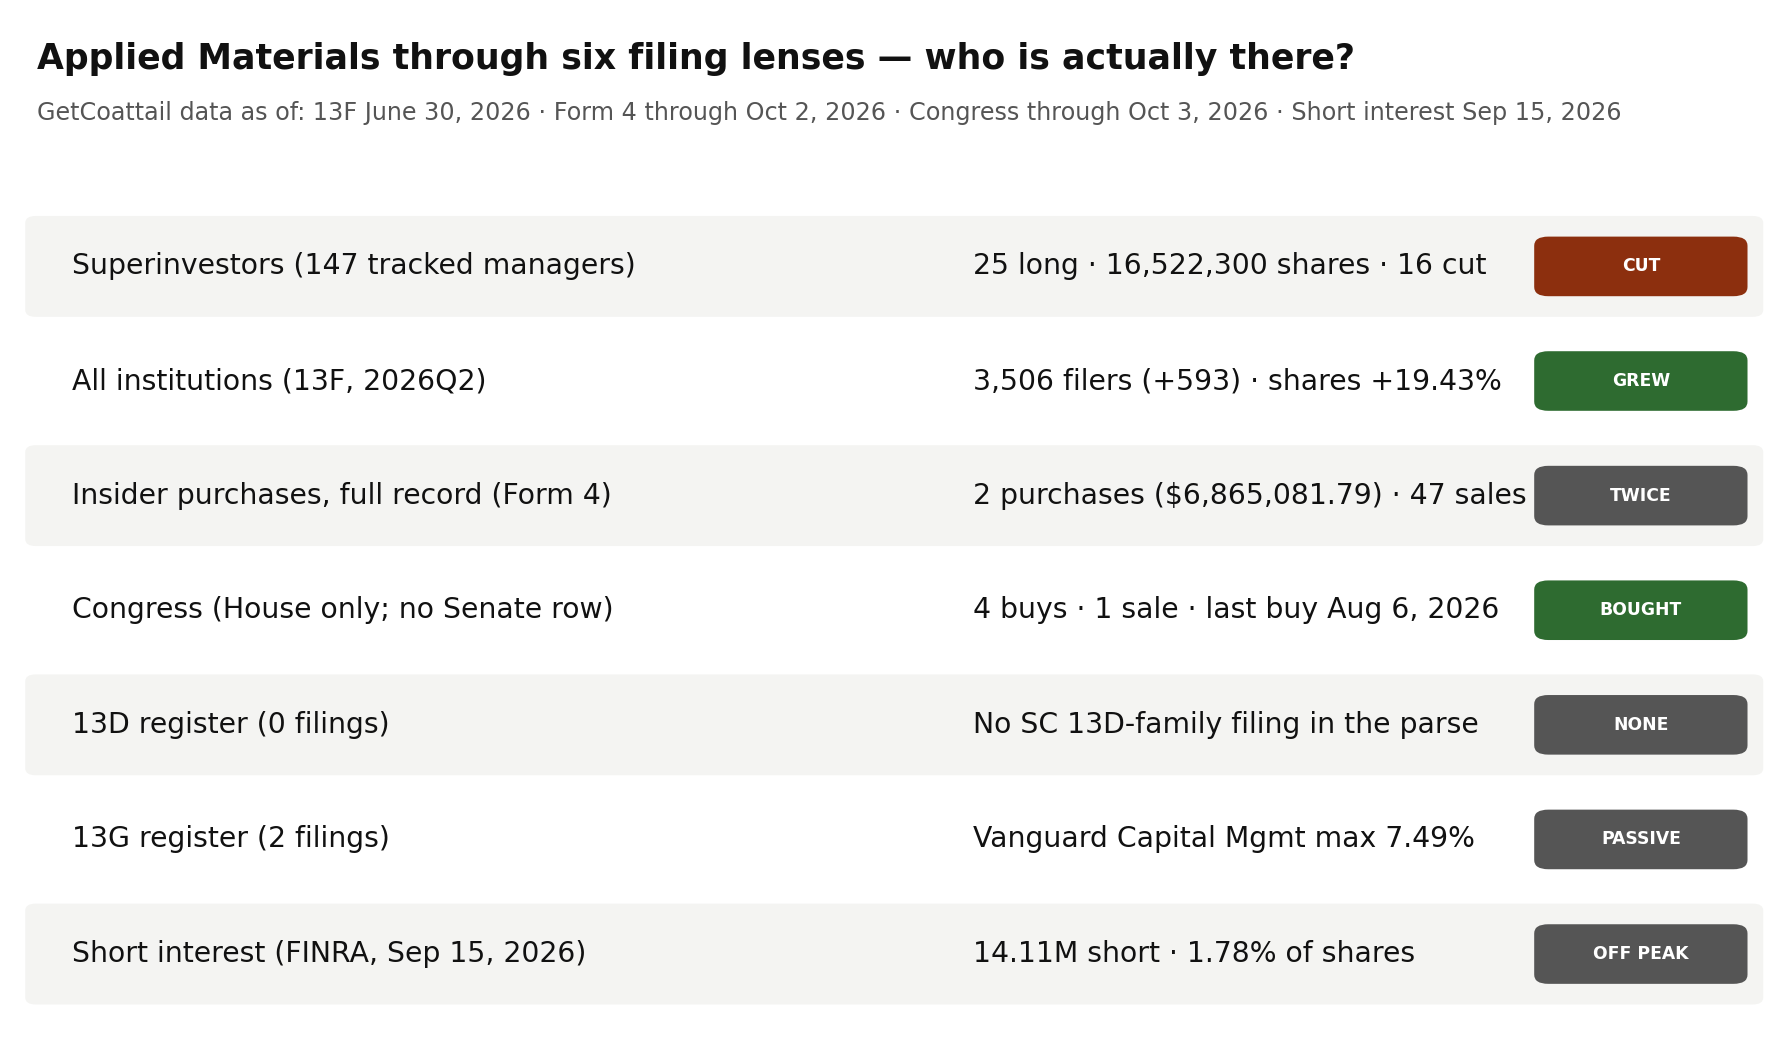
Lens 2 — institutions: 593 more filers, 106.6 million more shares. At June 30, 2026, 3,506 institutions reported positions, up 593 from 2,913 at March 31 (+20.36%); 3,495 are long. Reported shares rose 19.43%, from 548,691,494 to 655,304,783 shares. Reported value rose 156.38% to $474,410,578,522, labelled "reported" because the aggregate includes option rows (see methodology).
Lens 3 — insiders: two purchases in the entire parsed record, both over a year old. The parsed Form 4 record holds 76 filings through October 2, 2026 and exactly two purchase transactions across the full record — 50,000 shares for $6,865,081.79, both officer purchases by one buyer. Both sit outside the last year: the 90-day and one-year windows each hold zero purchases. The 90-day window holds 2 sale transactions totalling 8,500 shares and $4,059,375.75, by 2 sellers, 1 an officer sale. Across the last year the record holds 44 sales totalling 307,200 shares and $180,243,549.48, by 9 sellers, 38 of them officer sales; across the full record, 47 sales totalling 308,483 shares and $180,455,904.65, by 9 sellers, 41 of them officer sales.
Lens 4 — Congress: four purchases and one sale, all in the House file. The combined record (as of October 3, 2026) carries Applied Materials with 4 purchase transactions and 1 sale transaction, a last purchase on August 6, 2026, a members field of 3, and both parties present. The House aggregate is identical. The Senate aggregate (as of October 1, 2026) carries no row for this name at all — a missing row, not zero Senate trades.
Lens 5 — the 5% register: two filings, two names, all of them Vanguard. Our full parse holds 2 SC 13D/G filings — one SC 13G and one SC 13G/A, no SC 13D-family filing in the parse — 2 reporting-person rows across 2 names, 1 an amendment, most recently filed April 29, 2026; the maximum is 7.49%: Vanguard Capital Management reports 59,459,172 shares as of March 31, 2026. The other row prints The Vanguard Group at 0 shares (0.0%) as of March 13, 2026.
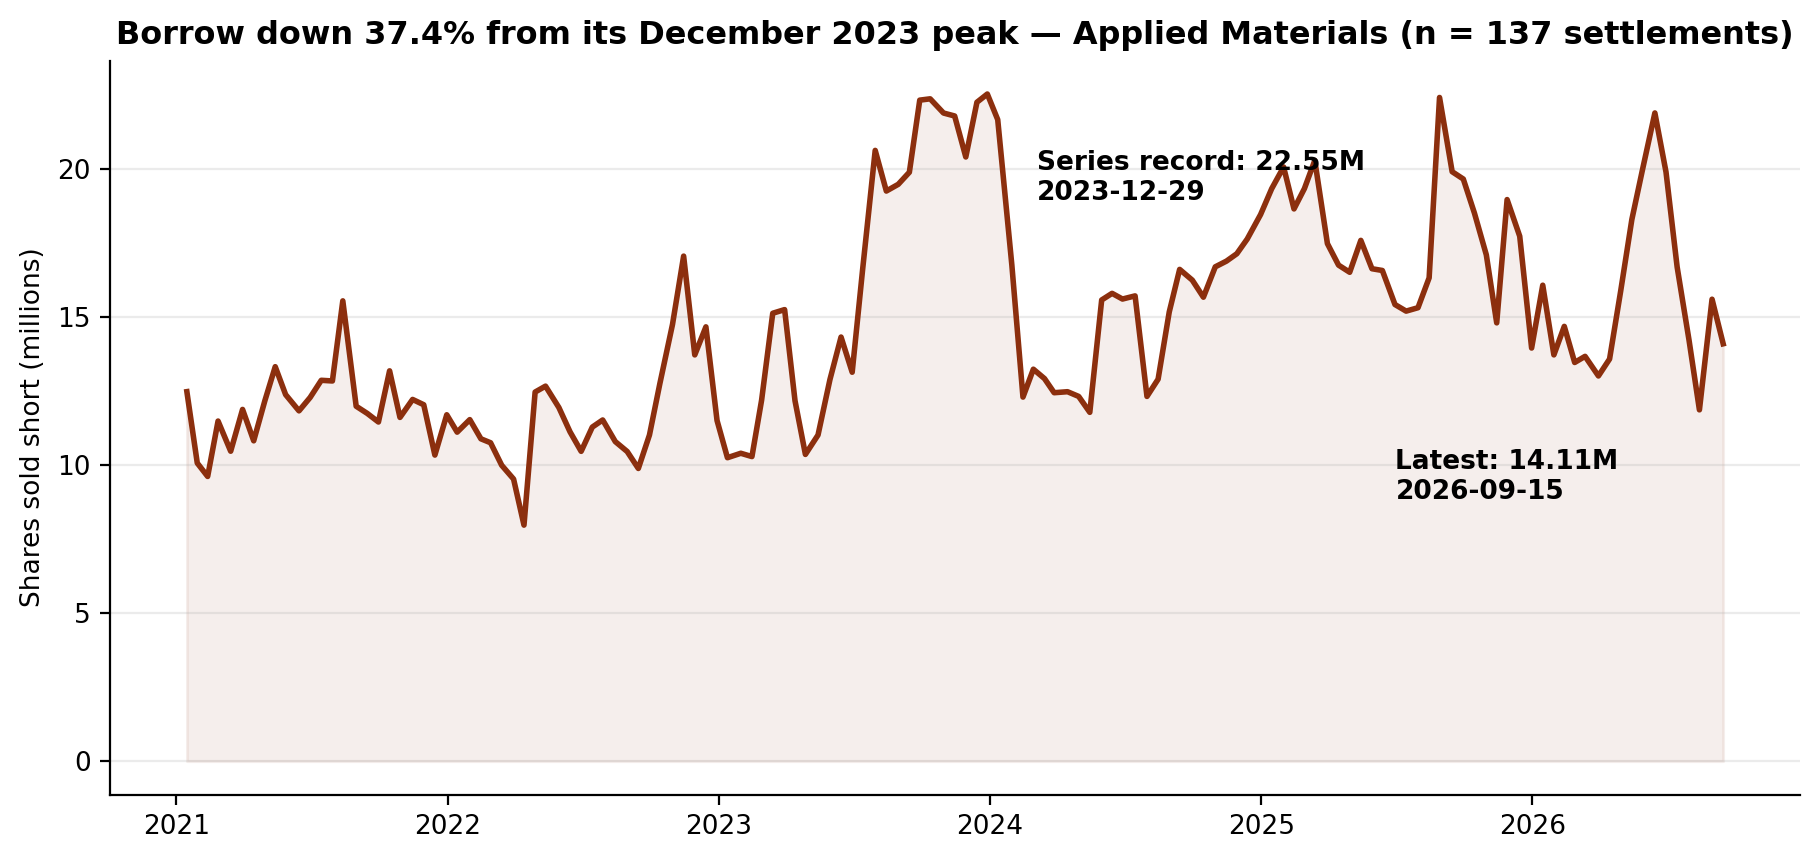
Lens 6 — short interest: 14,108,387 shares, down 37.4% from its peak. As of September 15, 2026 — the most recent of 137 FINRA settlements since January 15, 2021 — 14,108,387 shares were sold short, down 9.65% from the prior one. The series maximum, 22,550,819 shares on December 29, 2023 — verified by a maximum query over the series — leaves the latest 37.4% below it. Against the year-ago 19,925,504 shares the latest is down 29.2%; against the June 30 settlement of 19,913,996, also down 29.2%. Against 793,597,443 shares outstanding, it is 1.78% of the share count, at 2.44 days to cover.
The Gap
The narrative, as this month's coverage frames it, is a guidance gap meeting a valuation reset: an investor day that offered 2030 targets but no industry forecast for the year the market is pricing, in a stock that had risen 79% year to date and now sits about 36% below its June 30 record close. The filings describe positioning set before the slide, during the run. In Q2, as the price rose 111.5%, the full market held 655,304,783 reported shares, up 106,613,289 (+19.43%), as its filer count rose by 593 to 3,506. The cohort's labels point the other way: 16 of its 19 continuing holders cut, 3 stood still, none raised, its two largest holders — Sanders Capital at 36.9% of the cohort and Coatue Management at 25.5% — cut 1.3% and 19.7%, and the six new positions include one, Lone Pine Capital's 1,207,737 shares, that is larger than most of the register. The 5% register holds no activist filing and no name outside the Vanguard rows. Two lenses, though, do not fit the one-way pattern. The insider record holds two purchases — 50,000 shares, $6,865,081.79 — even if both are more than a year old, and the congressional record is a buying record: 4 purchases against 1 sale, the last of them on August 6, 2026, inside the quarter the stock was sliding from its high. The borrow, at 14,108,387 shares, sits 37.4% below its December 2023 peak. One plausible reading is that the broad market and the House file spent the run adding a stock its most-watched continuing holders were trimming — while the company's own insiders have not been recorded buying in over a year. The record supports each clause separately; it does not say which side the next quarter favours.
What Would Change the Picture
Nothing above is a recommendation. It is a record. These filings would change it:
- 1. The 2026Q3 13Fs (filing window closing mid-November 2026). The cohort held 16,522,300 shares at June 30 after a quarter with 16 cuts, 3 holds and no raises among continuing holders, and Sanders Capital alone is 36.9% of it. Whether Sanders trims again after the October slide — and whether any continuing holder prints a first INCREASED label — decides whether the register reads as stance or pause.
- 2. A third purchase — the record currently has exactly two, both over a year old. The parsed record holds two purchases across 76 filings, none in the last year. A single new open-market purchase changes a lens that is currently a sales register with two old exceptions.
- 3. A first activist filing, or a new name in the 5% register. Its 2 filings are all passive SC 13G-family, carrying only two Vanguard names; the latest, dated April 29, 2026, reports 7.49% as of March 31, 2026. A first SC 13D, or any new reporting person, would be this lens's first new fact in two quarters.
- 4. Whether the borrow keeps falling, or rebuilds toward the June print. Short interest stands at 14,108,387 shares, 37.4% below the December 29, 2023 record of 22,550,819 and 29.2% below the June 30 print of 19,913,996. A reading back above that print would end the drift down.
- 5. A first Senate row, or more House buying. The congressional record holds exactly five transactions — 4 purchases and 1 sale, all in the House file, the last purchase on August 6, 2026 — and the Senate file holds no row at all. A Senate row of either kind, or a House sale that outweighs the buying, changes a lens that currently only the House writes in.
As-of & Limits
The lenses rest on different clocks, none live: 13F is a June 30, 2026 snapshot published up to 45 days later; Form 4 runs through October 2, 2026; Congress through October 3, 2026 (Senate file through October 1, 2026); 13D/G through April 29, 2026; short interest through September 15, 2026; the price file ends October 2, 2026. Three limits are specific to this audit. First, the tracked roster expanded since the previous audits — from 85 managers (83 filing) to 149 managers (147 filing) — so this audit's "of 147" counts are not directly comparable to earlier pieces' "of 83" figures; earlier audits keep their 83 snapshot. Second, the October slide postdates every lens here and is known only from outside coverage, not from our own price file, so nothing in the tape yet reflects positioning after it. Third, one continuing holder's first-quarter pipeline row could not be verified row by row, so this audit publishes no cohort quarter-to-quarter total rather than a partial one dressed as a total (see methodology); its direction counts come from the EDGAR change labels themselves.
Related reading: Seven of 83: One Holder Is 71.7% of the Superinvestors' Lam Research Stake. Its Insiders Have Bought Once. — Filing Tape #84; Two of 83: The Superinvestors Hold Just 1,275 Lumentum Shares. Its Insiders Have Never Bought a Share. — Filing Tape #83. Applied Materials' own page: Applied Materials (AMAT) on GetCoattail.
Methodology and data notes
- Superinvestor lens: 147 filing managers (of a 149-manager roster) collected directly from SEC EDGAR Form 13F (managers_13f collection, regenerated October 15, 2026 for the expanded roster), positions as of June 30, 2026; Applied Materials identified by its single cohort CUSIP 038222105. Twenty-five distinct managers hold long positions totalling 16,522,300 shares; there are no option rows for this name in the collection, and the collection's exit list carries no Applied Materials row. The direction count on the collection's labels, across the long rows, is sixteen DECREASED, three UNCHANGED (Thomas Gayner - Markel Group, Saturna Capital and Glenn Greenberg - Brave Warrior Advisors) and six NEW (Stephen Mandel - Lone Pine Capital, John Armitage - Egerton Capital, Sarasin & Partners, Samlyn Capital, Winslow Capital Management and Harding Loevner); there is no INCREASED row. Sanders Capital's share of the cohort is 36.9% = 6,094,372 / 16,522,300; Coatue Management's is 25.5% = 4,213,483 / 16,522,300. The cohort's reported values imply $717.01 per share against a June 30, 2026 close of $723.00 in our price file, a gap of -0.83% — printed here as found: most rows imply exactly $723.00, but two rows imply $511.38 as filed (David Katz - Matrix Asset Advisors and Sarasin & Partners) and one implies $739.55 (DJE Kapital), so this audit headlines share counts and labels the dollar total as the sum as filed. Quarter-to-quarter cohort totals require care in this audit, and this audit does not publish one: the site pipeline's holdings files cover 147 accessions (the expanded roster), so their CUSIP totals — 20,235,925 shares in 19 rows at March 31 and 16,094,092 shares in 24 rows at June 30 — are not the 147-manager EDGAR cohort, whose second-quarter file carries rows the pipeline file does not (Sarasin & Partners among them). Following the rule used in the previous audit, each continuing holder's first-quarter row was accepted only when (a) it sits under the same filing-agent prefix as the manager's second-quarter accession — the pipeline files' accession prefixes identify filing agents, not managers, and several prefixes are shared — and (b) the row's implied shares-change reproduces the manager's EDGAR shares-change label at one decimal place. Eighteen of the nineteen continuing holders verify exactly that way; their verified subtotal runs from 20,177,392 shares at March 31 to 14,223,692 shares at June 30 (-5,953,700 shares, -29.5%), and it is printed here as a subtotal covering 18 of 19 holders, not as the cohort total. The nineteenth, David Katz - Matrix Asset Advisors (47,847 shares, DECREASED -0.4%), cannot be verified: its manager has no exact total-value match in the pipeline second-quarter file, so no prefix can be assigned, and the one unassigned first-quarter row (58,533 shares) implies -18.3% against its -0.4% label, so it is not its row. The six NEW holders have no first-quarter row by definition.
- Full-market lens: SEC Form 13F Data Sets full-market aggregation. The primary table is the full13f collection's by-ticker file (holders = distinct filers reporting the ticker's CUSIP; 3,495 reported long positions out of 3,506 filers). Applied Materials carries a single CUSIP in this aggregation (038222105), and the backfill fixtures' by-CUSIP row for it matches the by-ticker row on every field — holders, long holders, shares, reported value, prior holders and prior reported value — exactly. The by-ticker file's entered/exited fields (2,306 and 1,713, a net of +593 that matches the change in holder count) are gross flows, so this audit headlines the net change. Reported-value caution: the aggregate value ($474,410,578,522 over 655,304,783 shares) implies $723.95 per share against a June 30, 2026 close of $723.00 in our price file, a gap of +0.13% — printed here as found. The aggregate sums the VALUE of every information-table row — including put and call option rows — while the share count covers long common-stock rows only, so we headline filer and share counts and label dollar values "reported."
- Insider lens: full-parse Form 4 aggregation (agg_by_ticker), record as of October 2, 2026 (76 filings). Sale and purchase counts are transaction-code counts (S and P) in non-derivative rows; grants and exercises are not counted as purchases, and one filing can contain many transaction rows. Purchase transactions total two in the full parsed record — 50,000 shares for $6,865,081.79, both of them also officer purchase transactions, by one buyer — and zero in the 90-day window (July 5 to October 2, 2026) and zero in the one-year window, which places both purchases before October 3, 2025 in the aggregation's windows; the aggregate does not carry their dates, so this audit does not date them. Sale transactions total 2 in the last 90 days (8,500 shares, $4,059,375.75, 2 sellers, 1 of the 2 officer sales), 44 in the last year (307,200 shares, $180,243,549.48, 9 sellers, 38 of the 44 officer sales) and 47 across the parsed record (308,483 shares, $180,455,904.65, 9 sellers, 41 of the 47 officer sales). The site's insider aggregate (compiled as of October 15, 2026, over its own 90-day window) reports 0 purchases, 2 sales and 2 sellers with $4,059,375.75 of sale value — an exact match to the full parse's 90-day window on every field. The full-parse aggregate's sale-value totals imply $477.57 per share for the 90-day window, $586.73 for the one-year window and $584.98 for the full record, each inside the traded price range of its window on our price file ($415.38 to $602.50 for the 90-day window, $209.95 to $723.00 for the one-year window, and $74.41 to $723.00 across the price file); the two purchases imply $137.30 per share, inside the price file's full range and below the one-year window's low, consistent with both purchases sitting outside the last year, so the totals are cited as figures in this article. "Its insiders have bought twice" in this audit means two purchase transactions in the parsed Form 4 record we maintain; it is a statement about that record, not about any individual's complete history.
- 13D/G lens: full-parse SC 13D/G parsed filings (2 filings matching issuer CIK 6951 on CUSIP 038222105: one SC 13G and one SC 13G/A filing, the G/A filing being an amendment, with no SC 13D-family filing in the parse), filings through April 29, 2026. The site aggregation carries this name under a ticker-keyed row; that row (2 filings, 0 D-filings, 2 G-filings, 1 amendment, 2 reporters, latest date April 29, 2026, maximum 7.49% and 59,459,172 reported shares) matches the parsed filings on filings, form mix, amendments, latest date, maximum and reported-share total. The parsed reporting-person rows sum to 59,459,172 shares, but that total sums reporting-person rows across different dates, so it is not used as a stake figure in the article. The rows are reported as filed, under the names exactly as they appear: Vanguard Capital Management printing 59,459,172 shares at 7.49% as of March 31, 2026, filed April 29, 2026 as SC 13G; The Vanguard Group printing 0 shares at 0.0% as of March 13, 2026, filed March 26, 2026 as SC 13G/A. The two Vanguard names are separate reporting persons as filed and are not combined in this audit. The parsed coverage for this issuer holds these 2 filings; a 5% holder that has not filed in the covered window would not appear here.
- Congress lens: Senate PTR archive and House PTR archive as maintained on this site. The combined record (as of October 3, 2026) carries Applied Materials with 4 purchase transactions and 1 sale transaction, a last purchase on August 6, 2026, a members field of 3, and both parties present. The House aggregate (as of October 3, 2026) carries the identical row, so every transaction in the combined record sits in the House file. The Senate aggregate (as of October 1, 2026) carries no row for this name; this audit reports that as a missing row and does not convert it into a claim of zero Senate transactions — the House rows are the fact reported here.
- Short interest lens: FINRA Equity Short Interest files (biweekly settlement dates), collected directly from FINRA's public distribution. The published series covers 137 settlements from January 15, 2021 (first settlement in the series, 12,490,683 shares) to September 15, 2026. The latest reading is 14,108,387 shares on September 15, 2026, down 9.65% from the prior settlement (15,615,253 on August 31, 2026). The series maximum is 22,550,819 shares on December 29, 2023 (verified by a maximum query over the series, not read off the latest row), so the latest reading sits 37.4% below the maximum. The year-ago settlement (September 15, 2025) printed 19,925,504 shares, so the latest reading sits 29.2% below a year ago. The series minimum is 7,979,020 shares on April 14, 2022. One comparability note on this series: the files report each settlement as filed and do not restate earlier settlements, but the largest step between consecutive settlements in this series is 1.564x, so no split-style jump distorts the share comparisons, and every percentage comparison in this audit is computed across the full series as published. The June 30, 2026 settlement printed 19,913,996 shares, so the latest reading sits 29.2% below the 13F snapshot date's borrow. FINRA publishes each settlement about two weeks after the fact, so the October price action is not yet in this series. The share-count ratio (1.78%) uses the fundamentals file's shares-outstanding figure below.
- Fundamentals note: our fundamentals collection carries Applied Materials' revenue of $28,368,000,000, net income of $6,998,000,000 and assets of $36,299,000,000, each labelled fiscal 2025 in the file. The file is marked ok for this name, with no missing fields: shares outstanding of 793,597,443 (as of July 26, 2026 in the file, sourced in the file to the share count) and a file-computed market value of $420,820,931,599.56. The file does not flag the issuer as a foreign private issuer, and it carries SIC 3674, Semiconductors & Related Devices. The file's price for the name is $530.27 as of October 6, 2026; our daily-close file ends October 2, 2026 at $540.04, and we keep the two files' figures separate rather than blending them.
- Prices: our own daily-close file for Applied Materials through October 2, 2026 ($540.04 close, +110.1% year to date on that file; the 252-session closing high is $723.00 on June 30, 2026, so the last close sits 25.3% below it; 252-session closing low $209.95 on October 10, 2025, so the last close sits 157.2% above it; closes of $341.79 at March 31, 2026 and $723.00 at June 30, 2026, a second-quarter change of +111.5%; change from June 30 to October 2 of -25.3%; change from the September 30, 2025 close of $204.74 of +163.8%). The series in our price file begins June 1, 2021 at $138.21 and holds 1,342 rows.
- Market context sources: StockTwits/Asianet's stocks-in-focus list for the October 14 session (checked October 15, 2026; its order was CoreWeave, Nebius, NVIDIA and ImmunityBio — the first three already covered in this series, and ImmunityBio was skipped because most of its lenses are empty in our data); Barchart's October 14 market summary (checked October 15, 2026; it listed the chip decliners in order — CoreWeave, Lumentum, AMD, ARM, Marvell, Lam Research, then Applied Materials, down more than 2% in the chip group); Barron's investor-day report (checked October 15, 2026; the stock fell 7.7% to $459.20 in the October 13 session, on pace for a sixth straight loss, the chief executive declined to give a wafer-fab-equipment forecast, the 2030 targets were free-cash-flow returns of 80–100%, WFE share up two points, adjusted gross margin near 54% and adjusted operating margin near 40%, and the shares were up 79% year to date, down about 10% in October and about 36% below the June 30 record close of $723); StockTwits' October 14 semiconductor wrap (checked October 15, 2026; the semiconductor ETF fell more than 4% on its way to a seventh straight losing session, and over the six-session slide ARM fell nearly 16%, Applied Materials about 14% and Intel 11%); Barchart's futures wrap (checked October 15, 2026; Applied Materials fell more than 6% in the prior session and was the top percentage loser in the S&P 500 and the Nasdaq 100); Barchart's October 14 close wrap (checked October 15, 2026; the S&P 500 fell 1.11%, the Dow 0.09% and the Nasdaq 100 2.02%, and September CPI printed +3.7% year over year against +3.6% expected). A secondary source listed a November 12, 2026 earnings date for this name; we could not confirm it against two sources, so it is not used. Figures we could not confirm against two sources were left out; the external items above are reported speech from those outlets, not GetCoattail measurements.
- Applied Materials is in the GetCoattail stock-page universe: Applied Materials (AMAT) stock page. Series data: amat_lens_data.csv · amat_short_interest_series.csv. Earlier audits: Lam Research · Lumentum.
Past patterns are not a promise of future results. For education only — not investment advice.
This article describes public filings as of the dates stated. It is not investment advice and makes no recommendation. Filings lag reality: 13F positions are as of June 30, 2026, and later trading is not yet public.
Revision history
- v1.0 — October 15, 2026: first publication.