GetCoattail Research — The Filing Tape #84. Lam Research fell 4.71% on October 14, its eighth straight loss, and the filings describe a tracked cohort that cut its stake 18.5% in the quarter the price doubled, a full market that added 184,874,020 shares, an insider record with exactly one purchase transaction — 9.46 shares for $601.91 — against $187,261,538.86 of sales, an all-passive 5% register whose only names are Vanguard entities, and a borrow down 30.3% from its peak.
The Hype
Lam Research sells the etch and deposition tools chipmakers cannot expand without, and its most recent reported quarter set records — revenue of $6.72 billion, up 30% year over year, with adjusted earnings of $1.82 a share. The stock doubled in the second quarter in our daily-close file, ending June 30 at its 252-session closing high. October has run the other way: the shares fell for seven straight sessions into Tuesday, then fell again on Wednesday, October 14 — down 4.71% to $286.92, an eighth consecutive loss, on volume of 10.3 million shares against a 50-day average of 8.4 million. That close sits 34.57% below the 52-week high of $438.50 recorded on June 30, in a session when hotter-than-expected inflation hit the whole semiconductor complex and the chip ETF fell more than 4%. Lam's next test is dated — an expected October 21 report — and ASML's record quarter and raised outlook on October 14 already failed to hold the sector up. The filings below describe who held the stock before this slide, through a quarter in which the price rose 102.8%.
The Tape
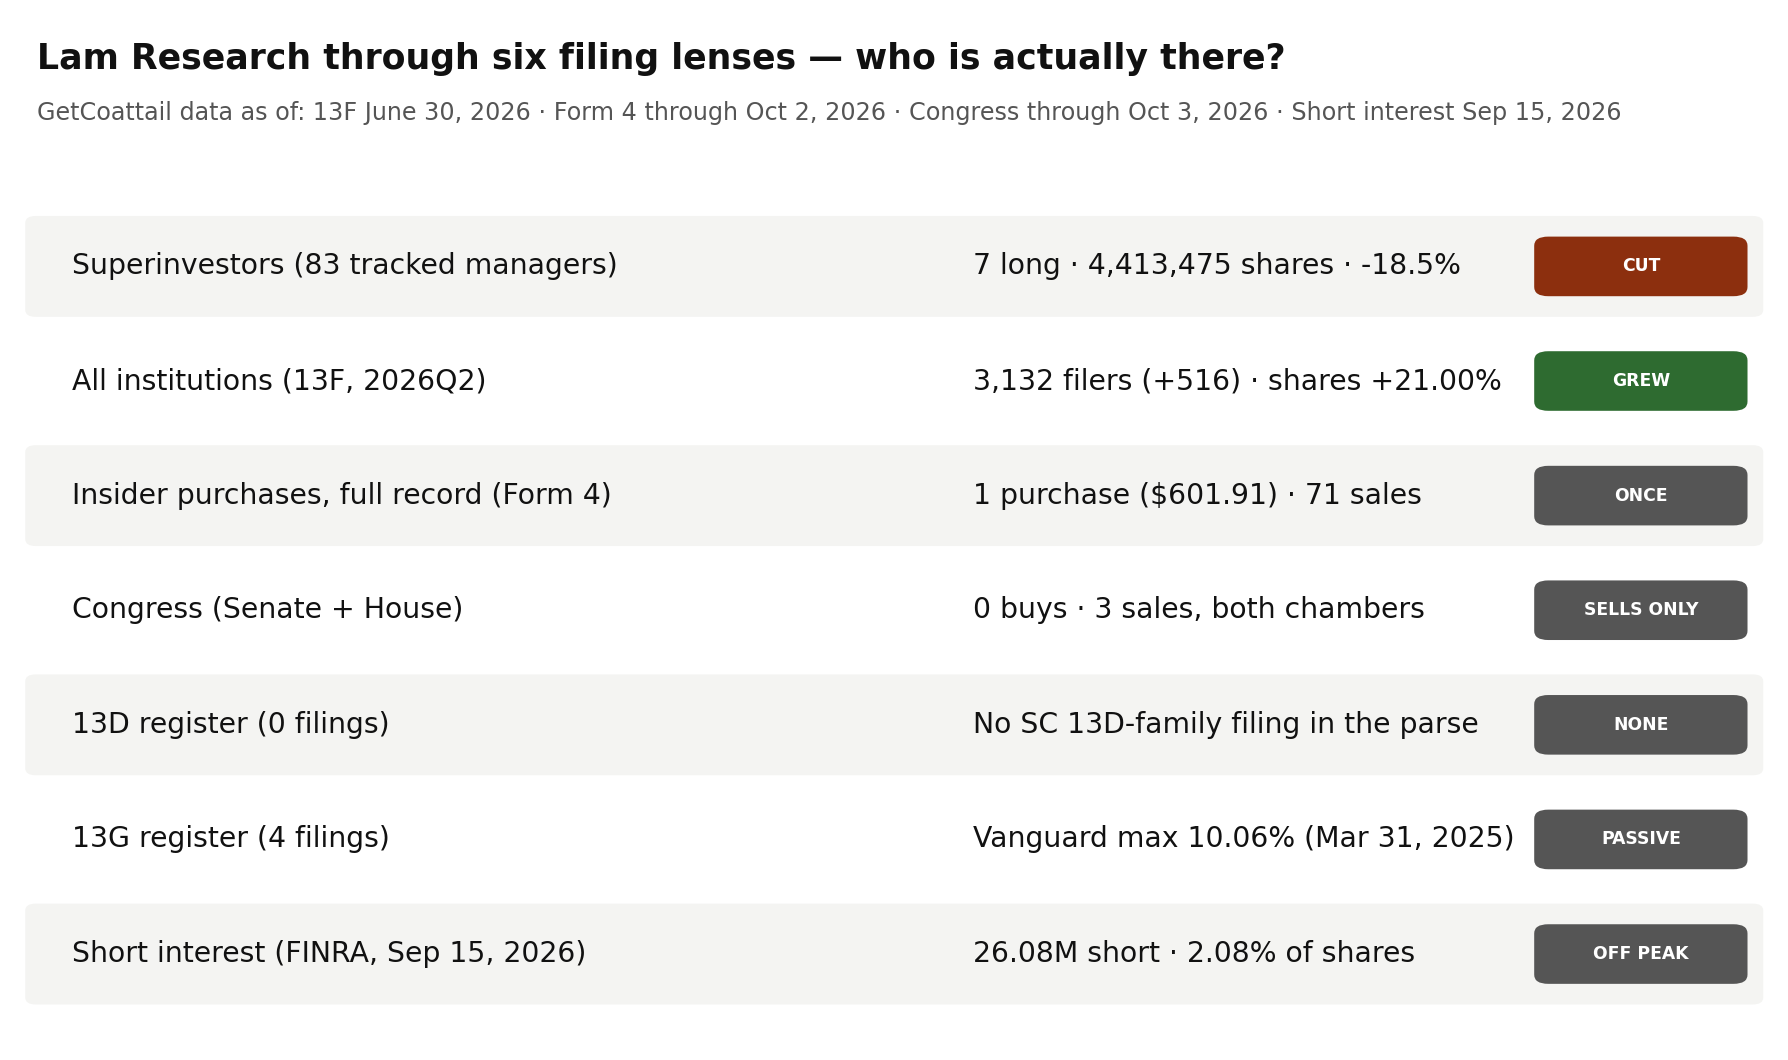
For Lam Research — the eighty-fourth Filing Tape audit — the tape shows a seven-name tracked cohort whose largest holder is 71.7% of the position and which cut its stake 18.5% while the price doubled, a full market that added 184,874,020 shares in the same quarter, an insider record with one purchase transaction in its entire parsed history against 71 sales, a congressional record of three sales and no purchases across both chambers, a 5% register of four filings carrying only Vanguard names, and a borrow down 30.3% from its January 2025 peak.
| Lens | As of | What the filings show | Direction vs prior period |
|---|---|---|---|
| Superinvestors (13F) | Jun 30, 2026 | 7 long holders; 4,413,475 shares; $1,912,491,357 | Holders 5 → 7 (1 exit, 3 new); shares -18.5% vs Q1 cohort |
| All institutions (13F) | Jun 30, 2026 | 3,132 filers; 1,065,089,191 shares | Filers +516; shares +21.00% |
| Insiders (Form 4) | Oct 2, 2026 | 1 purchase in the full parsed record; last 90 days: 9 sales | No purchase in the last year; 71 sales in the full record |
| Congress | Oct 3, 2026 | 0 purchases and 3 sales (House 2, Senate 1); members field 0 | No reported purchase in the record |
| 13D/G | Apr 30, 2026 | 4 parsed filings (all SC 13G-family, 0 SC 13D-family); register maximum 10.06% (The Vanguard Group) | Latest filing reports 7.49% as of Mar 31, 2026 |
| Short interest (FINRA) | Sep 15, 2026 | 26,081,081 shares; 2.08% of shares outstanding | Down 30.3% from the series maximum; down 16.2% year over year |
Lens 1 — the superinvestors: seven holders, one of them 71.7% of the stake, and a cohort that trimmed into a doubling. We track 83 large, mostly long-only managers whose 13F portfolios we collect directly from SEC EDGAR. As of June 30, 2026, 7 held Lam Research long, totalling 4,413,475 shares worth $1,912,491,357, with no option rows. Chase Coleman - Tiger Global Management is the largest holder, with 3,163,495 shares worth $1,370,837,288 — 71.7% of the cohort — at a 5.72% weight, labelled DECREASED (-18.9%). Polen Capital Management holds 859,036 shares worth $372,246,307 — 19.5% of the cohort — also DECREASED (-18.5%). David Tepper - Appaloosa Management (382,500 shares, $165,748,725) and Christopher Davis - Davis Advisors (2,780 shares, $1,204,657) are both UNCHANGED, and three managers opened new, small positions: Lee Ainslie - Maverick Capital (4,083 shares), Sarah Ketterer - Causeway Capital Management (816 shares) and Mairs & Power Funds (765 shares). The exit list carries one name: Daniel Loeb - Third Point exited 75,000 shares worth $16,024,500 — valued at exactly the March 31 close of $213.66. Counting the exited holder, the cohort went from 5,415,214 shares at March 31 to 4,413,475 at June 30, down 1,001,739 shares (-18.5%), in a quarter when the price rose 102.8%. 13F figures are as of June 30, 2026; funds have up to 45 days to file, so this picture is complete — and always lagging.
Lens 2 — institutions: 516 more filers, 184.9 million more shares. At June 30, 2026, 3,132 institutions reported positions, up 516 from 2,616 at March 31 (+19.72%), 3,122 of them long. Reported shares rose 21.00%, from 880,215,171 to 1,065,089,191 shares. Reported value rose 146.16% to $459,779,755,614, labelled "reported" because the aggregate includes option rows (see methodology).
Lens 3 — insiders: one purchase transaction in the entire parsed record, for $601.91. The parsed Form 4 record holds 71 filings through October 2, 2026, and exactly one purchase transaction across the full record — 9.46 shares for $601.91, recorded as an officer purchase. It sits outside the last year: the 90-day and one-year windows each hold zero purchases. The selling side is full: the 90-day window holds 9 sale transactions totalling 182,589 shares and $58,329,210.18, by 5 sellers, 7 of them officer sales. Across the last year the record holds 69 sales totalling 720,222 shares and $177,354,338.86, by 9 sellers, 20 of them officer sales; across the full record, 71 sales totalling 830,302 shares and $187,261,538.86, by 9 sellers, 22 of them officer sales.
Lens 4 — Congress: three transactions, all of them sales, in both chambers. The combined record (as of October 3, 2026) carries Lam Research with 0 purchase transactions and 3 sale transactions, no last-purchase date, and a members field of 0. The split is not one-sided by chamber: the House aggregate carries 2 of the sales, the Senate aggregate 1.
Lens 5 — the 5% register: four filings, two names, all of them Vanguard. Our full parse holds 4 SC 13D/G filings — two SC 13G and two SC 13G/A, with no SC 13D-family filing in the parse — 4 reporting-person rows across 2 names, 2 of them amendments, most recently filed April 30, 2026. The register's maximum is 10.06%: The Vanguard Group reports 129,149,892 shares as of March 31, 2025, printed twice with identical figures — filed April 7, 2025 as SC 13G and April 8, 2025 as SC 13G/A. The same name later prints 0 shares (0.0%) as of March 13, 2026, and Vanguard Capital Management prints 93,575,293 shares (7.49%) as of March 31, 2026 — the latest filing.
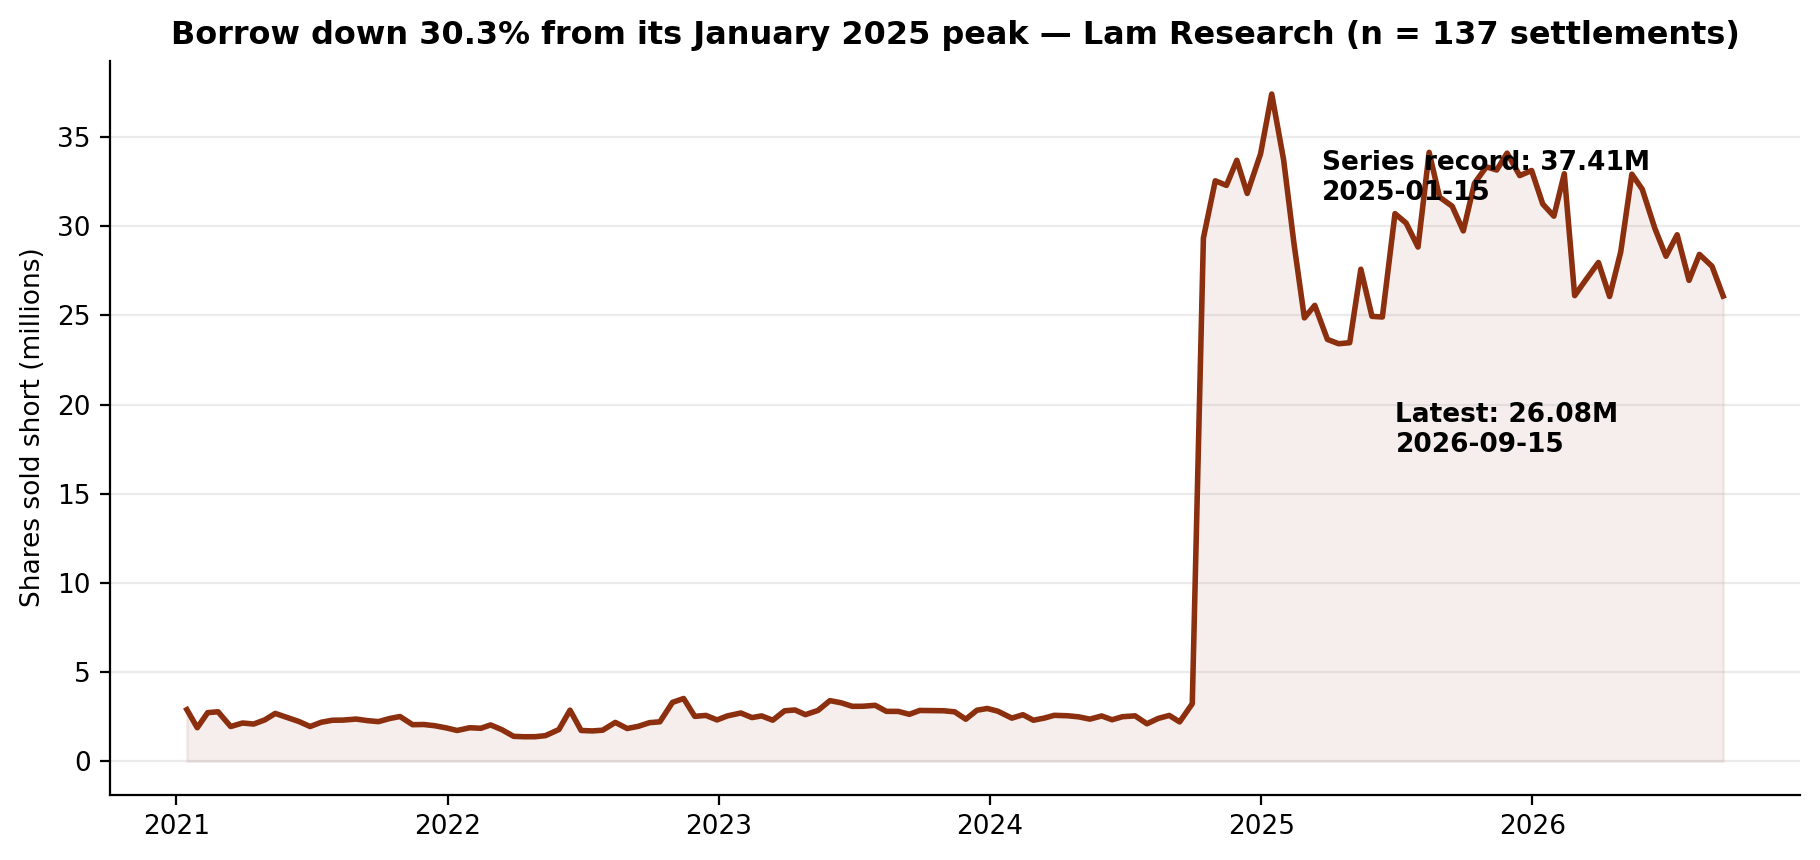
Lens 6 — short interest: 26,081,081 shares, down 30.3% from its peak. As of September 15, 2026 — the most recent of 137 FINRA settlements since January 15, 2021 — 26,081,081 shares were sold short, down 6.02% from the prior settlement. The series maximum, 37,412,627 shares on January 15, 2025 — verified by a maximum query over the series — leaves the latest 30.3% below it. Against the year-ago 31,121,222 shares the latest is down 16.2%; against the June 30 settlement of 28,314,664, down 7.9%. Against 1,251,321,000 shares outstanding, it is 2.08% of the share count, at 3.08 days to cover.
The Gap
The narrative, as this month's coverage frames it, is a record equipment cycle meeting a valuation reset: record revenue up 30% year over year in the latest reported quarter, an ASML print on October 14 that set records and raised its outlook — and an eight-session slide that has taken the stock 34.57% below its June 30 high anyway, into an October 21 report. The filings describe positioning set before the slide, during the run. In Q2, as the price rose 102.8%, the full market held 1,065,089,191 reported shares, up 184,874,020 (+21.00%), as its filer count rose by 516 to 3,132. The tracked cohort went the other way: down 1,001,739 shares (-18.5%) to 4,413,475, with both large holders — Tiger Global Management at 71.7% of the cohort and Polen Capital Management at 19.5% — cutting 18.9% and 18.5% respectively, a third manager exiting, and the three new positions totalling 5,664 shares between them. The 5% register holds no activist filing and no name outside the Vanguard rows, whose maximum print, 10.06% as of March 31, 2025, is followed by a 0-share print under one Vanguard name and a 7.49% print under another. The insider record holds one purchase — 9.46 shares, $601.91, outside the last year — against 71 sales and $187,261,538.86. Congress holds three sales and no purchases. The borrow, at 26,081,081 shares, sits 30.3% below its January 2025 peak. One plausible reading is that the broad market spent the doubling quarter adding a stock its most-watched holders were trimming, while nobody on any tracked register — insider, member of Congress, or 5% filer — was recorded adding in size. The record supports each clause separately; it does not say which side the next quarter favours.
What Would Change the Picture
Nothing above is a recommendation. It is a record. These filings would change the description:
- 1. The 2026Q3 13Fs (filing window closing mid-November 2026). The cohort held 4,413,475 shares at June 30 after cutting 18.5% in a quarter when the price rose 102.8%, and Tiger Global Management alone is 71.7% of what remains. Whether Tiger Global trims again after the October slide — and whether the three small new positions grow — decides whether the register reads as stance or pause.
- 2. A second purchase — the record currently has exactly one, for $601.91. The parsed record holds one purchase across 71 filings, none in the last year. A single new open-market purchase changes a lens that is currently a sales register with one small exception.
- 3. A first activist filing, or a new name in the 5% register. The register's 4 filings are all passive SC 13G-family, carrying only two Vanguard names; its latest, dated April 30, 2026, reports 7.49% as of March 31, 2026. A first SC 13D, or any reporting person outside those names, would be this lens's first new fact in two quarters.
- 4. Whether the borrow resumes falling, or rebuilds toward its peak. Short interest stands at 26,081,081 shares, 30.3% below the January 15, 2025 record of 37,412,627 and 7.9% below the June 30 print of 28,314,664. A reading back above the June print would end the drift down.
- 5. A first congressional purchase of any kind. The record holds exactly three transactions — 3 sales, 0 purchases, split 2 in the House and 1 in the Senate. A purchase row in either chamber changes a lens that currently only sells.
As-of & Limits
The lenses rest on different clocks, none live: 13F is a June 30, 2026 snapshot published up to 45 days later; Form 4 runs through October 2, 2026; Congress through October 3, 2026 (Senate through October 1, 2026); 13D/G through April 30, 2026; short interest through September 15, 2026; our price file ends October 2, 2026. Two limits are specific to this name. First, the October slide postdates every lens here and is known to this audit only from outside coverage, not from our own price file, so nothing in the tape yet reflects positioning after it, and the October 21 report is still ahead. Second, the congressional aggregates print a members field of 0 in all three files while carrying 3 sale transactions, so this audit reports the counts and the chamber split and names no member; a reader who needs the members must go to the underlying PTRs.
Related reading: Two of 83: The Superinvestors Hold Just 1,275 Lumentum Shares. Its Insiders Have Never Bought a Share. — Filing Tape #83; Four of 83: Every Superinvestor in Coherent Cut in Q2 While the Price Rose 65.6%. Its Insiders Have Never Bought a Share. — Filing Tape #82; Seven of 83: Four Superinvestors Raised Progressive in Q2. Its Insiders Have Never Bought a Share. — Filing Tape #81. Lam Research's own page: Lam Research (LRCX) on GetCoattail.
Methodology and data notes
- Superinvestor lens: 83 managers collected directly from SEC EDGAR Form 13F (managers_13f collection), positions as of June 30, 2026; Lam Research identified by its single cohort CUSIP 512807306. Seven distinct managers hold long positions totalling 4,413,475 shares; there are no option rows for this name in the collection. The direction count on the collection's labels, across the long rows, is two DECREASED (Chase Coleman - Tiger Global Management and Polen Capital Management), two UNCHANGED (David Tepper - Appaloosa Management and Christopher Davis - Davis Advisors) and three NEW (Lee Ainslie - Maverick Capital, Sarah Ketterer - Causeway Capital Management and Mairs & Power Funds); the collection's exit list carries one Lam Research row — Daniel Loeb - Third Point, 75,000 shares at a previous value of $16,024,500, an implied $213.66 per share that matches the March 31, 2026 close in our price file exactly. Tiger Global Management's share of the cohort is 71.7% = 3,163,495 / 4,413,475; Polen Capital Management's is 19.5% = 859,036 / 4,413,475. Quarter-to-quarter cohort totals require care in this audit: the site pipeline's holdings files now cover 147 accessions (an expanded roster), so their CUSIP totals — 18,745,724 shares in 13 rows at March 31 and 17,730,909 shares in 16 rows at June 30 — are not the 83-manager cohort; the second-quarter file carries nine rows outside the EDGAR collection totalling 13,317,434 shares. The cohort comparison printed in this audit (5,415,214 shares at March 31, counting Tiger Global Management's 3,900,439 shares, Polen Capital Management's 1,054,495 shares, Davis Advisors' 2,780 shares, Appaloosa Management's 382,500 shares and Third Point's exited 75,000 shares; 4,413,475 shares at June 30, a change of -1,001,739 shares, -18.5%) is built manager by manager, and the matching needs one explicit correction: the pipeline files' accession prefixes identify filing agents, not managers, and the prefixes for Tiger Global Management (0000919574) and for the managers filed under 0001172661 are shared, so a naive prefix match assigns the same first-quarter row to two managers and assigns first-quarter rows to NEW holders. Each first-quarter row used here was therefore required to reproduce its manager's EDGAR shares-change label at one decimal place — Tiger Global Management -18.9%, Polen Capital Management -18.5%, Davis Advisors 0.0%, Appaloosa Management 0.0% — and all four do, exactly; the three NEW holders have no first-quarter row by definition, and Third Point's exited row is a named row in the first-quarter file.
- Full-market lens: SEC Form 13F Data Sets full-market aggregation. The primary table is the full13f collection's by-ticker file (holders = distinct filers reporting the ticker's CUSIPs; 3,122 reported long positions out of 3,132 filers). Lam Research carries two CUSIPs in this aggregation (512807306 and 512807108), and the backfill fixtures' by-CUSIP rows for them (3,108 holders, 3,098 long, 1,063,148,245 shares, $459,514,636,439 reported for the main CUSIP; 25 holders, 25 long, 1,940,946 shares, $265,119,175 reported for the second) sum to the by-ticker row's shares (1,065,089,191), reported value ($459,779,755,614) and prior reported value ($186,777,698,631) exactly; their holder counts sum to 3,133, one above the by-ticker count, because one filer reports both CUSIPs and is counted once in the by-ticker row, and their prior holder counts sum to 2,618, two above the by-ticker row's 2,616, for the same reason in the prior quarter. The by-ticker file's entered/exited fields (2,184 and 1,668, a net of +516 that matches the change in holder count) are gross flows, so this audit headlines the net change. Reported-value caution: the aggregate value ($459,779,755,614 over 1,065,089,191 shares) implies $431.68 per share against a June 30, 2026 close of $433.33 in our price file, a gap of -0.4% — printed here as found. The aggregate sums the VALUE of every information-table row — including put and call option rows — while the share count covers long common-stock rows only, so we headline filer and share counts and label dollar values "reported."
- Insider lens: full-parse Form 4 aggregation (agg_by_ticker), record as of October 2, 2026 (71 filings). Sale and purchase counts are transaction-code counts (S and P) in non-derivative rows; grants and exercises are not counted as purchases, and one filing can contain many transaction rows. Purchase transactions total one in the full parsed record — 9.46 shares for $601.91, also the record's one officer purchase transaction — and zero in the 90-day window (July 5 to October 2, 2026) and zero in the one-year window, which places the single purchase before October 3, 2025 in the aggregation's windows; the aggregate does not carry its date, so this audit does not date it. Sale transactions total 9 in the last 90 days (182,589 shares, $58,329,210.18, 5 sellers, 7 of the 9 officer sales), 69 in the last year (720,222 shares, $177,354,338.86, 9 sellers, 20 of the 69 officer sales) and 71 across the parsed record (830,302 shares, $187,261,538.86, 9 sellers, 22 of the 71 officer sales). The site's insider aggregate (compiled as of October 15, 2026, over its own 90-day window) reports 0 purchases, 7 sales and 4 sellers with $40,504,440.18 of sale value — two transactions and $17,824,770.00 below the full parse's 90-day window, a difference consistent with the two windows' different end dates (October 2 against October 15) moving sales across the window edge; this audit headlines the full parse. The full-parse aggregate's sale-value totals imply $319.46 per share for the 90-day window, $246.25 for the one-year window and $225.53 for the full record, each inside the traded price range of its window on our price file ($252.35 to $353.17 for the 90-day window, $131.37 to $433.33 for the one-year window, and $31.50 to $433.33 across the price file); the single purchase implies $63.63 per share, inside the price file's full range, so the totals are cited as figures in this article. "Its insiders have bought once" in this audit means one purchase transaction in the parsed Form 4 record we maintain; it is a statement about that record, not about any individual's complete history.
- 13D/G lens: full-parse SC 13D/G parsed filings (4 filings matching issuer CIK 707549 on CUSIP 512807306: two SC 13G and two SC 13G/A filings, the G/A filings being amendments, with no SC 13D-family filing in the parse), filings through April 30, 2026. The site aggregation carries this name under a ticker-keyed row; that row (4 filings, 0 D-filings, 4 G-filings, 2 amendments, 2 reporters, latest date April 30, 2026, maximum 10.06% and 351,875,077 reported shares) matches the parsed filings on filings, form mix, amendments, latest date, maximum and reported-share total. The parsed reporting-person rows sum to 351,875,077 shares, but that total sums reporting-person rows across different dates — including the same 129,149,892-share position printed on two consecutive days in two forms — so it is not used as a stake figure in the article. The rows are reported as filed, under the names exactly as they appear: The Vanguard Group printing 129,149,892 shares at 10.06% as of March 31, 2025, filed April 7, 2025 as SC 13G and again with identical figures on April 8, 2025 as SC 13G/A, then 0 shares at 0.0% as of March 13, 2026, filed March 27, 2026 as SC 13G/A; Vanguard Capital Management printing 93,575,293 shares at 7.49% as of March 31, 2026, filed April 30, 2026 as SC 13G. The two Vanguard names are separate reporting persons as filed and are not combined in this audit. The parsed coverage for this issuer holds these 4 filings; a 5% holder that has not filed in the covered window would not appear here.
- Congress lens: Senate PTR archive and House PTR archive as maintained on this site. The combined record (as of October 3, 2026) carries Lam Research with 0 purchase transactions and 3 sale transactions, no last-purchase date, an empty party field, and a members field of 0. The House aggregate (as of October 3, 2026) carries 2 of the sales and the Senate aggregate (as of October 1, 2026) carries 1, each with the same members field of 0 and no purchase row. This audit reports the counts and the chamber split exactly as the aggregates stand and does not fill either side with figures from outside those collections; in particular, it does not convert a members field of 0 into a claim that no member traded — the transaction rows are the fact reported here.
- Short interest lens: FINRA Equity Short Interest files (biweekly settlement dates), collected directly from FINRA's public distribution. The published series covers 137 settlements from January 15, 2021 (first settlement in the series, 2,889,541 shares) to September 15, 2026. The latest reading is 26,081,081 shares on September 15, 2026, down 6.02% from the prior settlement (27,751,158 on August 31, 2026). The series maximum is 37,412,627 shares on January 15, 2025 (verified by a maximum query over the series, not read off the latest row), so the latest reading sits 30.3% below the maximum. The year-ago settlement (September 15, 2025) printed 31,121,222 shares, so the latest reading sits 16.2% below a year ago. The series minimum is 1,371,686 shares on April 14, 2022. One comparability note on this series: the files report each settlement as filed and do not restate earlier settlements, and the reported count jumps from 3,222,540 on September 30, 2024 to 29,336,124 on October 15, 2024 — the signature of a share split in the source data — so pre-jump readings, including that minimum, are not directly comparable in share terms; every percentage comparison in this audit (peak, year-ago, June 30, prior settlement) is between post-jump settlements only. The June 30, 2026 settlement printed 28,314,664 shares, so the latest reading sits 7.9% below the 13F snapshot date's borrow. FINRA publishes each settlement about two weeks after the fact, so the October price action is not yet in this series. The share-count ratio (2.08%) uses the fundamentals file's shares-outstanding figure below.
- Fundamentals note: our fundamentals collection carries Lam Research's revenue of $23,232,690,000, net income of $7,265,396,000 and assets of $23,529,743,000, each labelled fiscal 2026 in the file. The file is marked ok for this name, with no missing fields: shares outstanding of 1,251,321,000 (as of August 4, 2026 in the file, sourced in the file to the share count) and a file-computed market value of $417,803,587,019.90. The file does not flag the issuer as a foreign private issuer, and it carries SIC 3559, Special Industry Machinery, NEC. The file's price for the name is $333.89 as of October 6, 2026; our daily-close file ends October 2, 2026 at $347.49, and we keep the two files' figures separate rather than blending them.
- Prices: our own daily-close file for Lam Research through October 2, 2026 ($347.49 close, +103.0% year to date on that file; the 252-session closing high is $433.33 on June 30, 2026, so the last close sits 19.8% below it; 252-session closing low $131.37 on October 10, 2025, so the last close sits 164.5% above it; closes of $213.66 at March 31, 2026 and $433.33 at June 30, 2026, a second-quarter change of +102.8%; change from June 30 to October 2 of -19.8%; change from the September 30, 2025 close of $133.90 of +159.5%). The series in our price file begins June 1, 2021 at $64.904 and holds 1,342 rows.
- Market context sources: MarketBeat Trending list (checked October 15, 2026; its top eleven names were all already covered or already skipped in this series, so the selection moved to the next source); Barchart's October 14 market summary (checked October 15, 2026; it listed the chip and AI-infrastructure decliners in order — CoreWeave, Lumentum, Marvell, ARM, AMD, SanDisk, Lam Research, Seagate, Microchip, Intel and Western Digital — with the semiconductor ETF down more than 4%); MarketWatch's October 14 Lam Research report (checked October 15, 2026; shares slid 4.71% to $286.92 on Wednesday, an eighth consecutive loss, closing 34.57% below the 52-week high of $438.50 recorded June 30, on volume of 10.3 million against a 50-day average of 8.4 million); TradingView's October 13 report, carrying Seeking Alpha (checked October 15, 2026; seven consecutive down sessions into Tuesday, the stock up nearly 76% year to date at that point, and an October 21 report date); MarketBeat's October 14 Lam Research summary (checked October 15, 2026; the latest reported quarter showed record revenue of $6.72 billion, up 30% year over year, adjusted earnings of $1.82 a share, and semiconductor-equipment shares had retreated as investors reassessed AI-related valuations ahead of earnings); eOption's October 14 market review (checked October 15, 2026; ASML reported quarterly results and an improved sales outlook the same day). Figures we could not confirm against two sources were left out; the external items above are reported speech from those outlets, not GetCoattail measurements.
- Lam Research is in the GetCoattail stock-page universe: Lam Research (LRCX) stock page. Series data: lrcx_lens_data.csv · lrcx_short_interest_series.csv. Earlier audits: Lumentum · Coherent.
Past patterns are not a promise of future results. For education only — not investment advice.
This article describes public filings as of the dates stated. It is not investment advice and makes no recommendation. Filings lag reality: 13F positions are as of June 30, 2026, and later trading is not yet public.
Revision history
- v1.0 — October 15, 2026: first publication.