GetCoattail Research — Broadcom is the market's custom-AI-chip story: fiscal third-quarter revenue up 85.5%, AI semiconductor revenue up 221%, and a consensus target near $527 against a price in the $350s. We ran it through every filing lens we maintain. In the second quarter — while the price rose 22.0% — the tracked superinvestors cut their share count 57.9%, even as their holder count rose.
Start with the narrative, because at the moment it is an AI infrastructure story being repriced in public. Broadcom reported fiscal third-quarter 2026 results for the period ended August 2, 2026, on September 2: revenue of $29.59 billion, up 85.5% year over year, GAAP net income of $13.09 billion, up 216%, GAAP earnings per share of $2.68 against $0.85 a year earlier, and non-GAAP earnings per share of $3.32, above a $3.22 consensus. AI semiconductor revenue rose 221% to $16.7 billion. Coverage since then has centred on customer financing — reports that banks are preparing $50 billion to $60 billion to help Anthropic, OpenAI and other customers buy or lease Broadcom chips — and on valuation: the stock fell 4.3% on October 8 to $360.14 in MarketBeat's account, which linked the move to an OpenAI revenue update that weighed on chip stocks, inside a 52-week range of $289.96 to $495.00. MarketBeat's consensus target stands at $527.20 from 41 firms with a Moderate Buy rating, StockAnalysis puts the average at $531.31 from 50 analysts, and UBS reiterated a Buy rating and a $470 target on October 2. Our own price file puts the October 2 close at $355.14.
Now the filings. GetCoattail tracks the investors best placed to know any company: superinvestors, institutions, insiders, Congress, and 5% holders. For Broadcom — the sixteenth Filing Tape audit, after IREN, CoreWeave, Micron, NVIDIA, Tesla, AMD, Apple, Amazon, Meta, Oracle, Dell, Bloom Energy, Palantir, Netflix and Starbucks — the narrow register and the broad register moved in opposite directions again, and the narrow register's move was one of the deepest cohort cuts in this series.
Lens 1: the superinvestors — thirteen holders, and the cohort more than halved
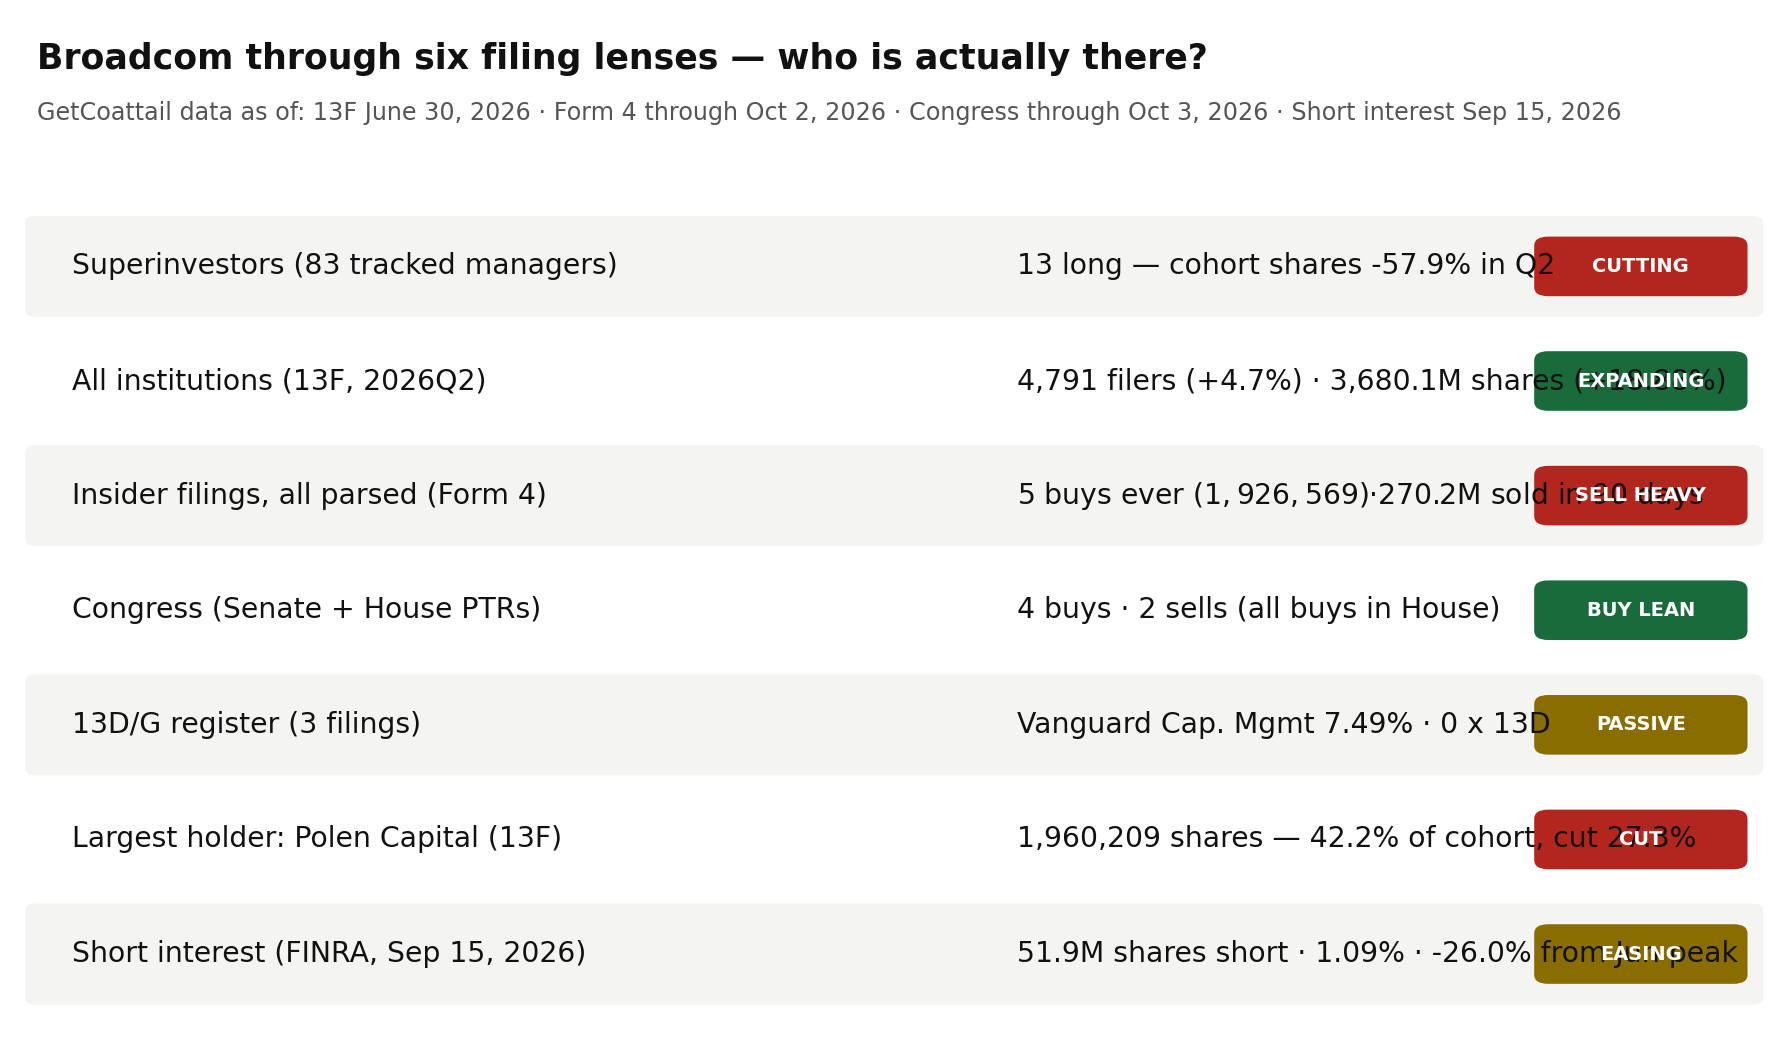
We track 83 large, mostly long-only managers whose 13F portfolios we collect directly from SEC EDGAR. As of June 30, 2026, thirteen held Broadcom in long common-stock positions — every reported row is a long position, with no option rows in the count. Their combined position is 4,640,134 shares worth $1,752,810,607. On a like-for-like pipeline basis the cohort more than halved in the second quarter, falling from 11,022,545 shares across twelve holders at March 31 to 4,640,134 shares across thirteen at June 30 — down 57.9% — in a quarter when the share price rose from $309.51 to $377.75 in our price file, up 22.0%. The pipeline and EDGAR-collection second-quarter totals agree exactly, at 4,640,134 shares.
Of the thirteen holders, two were new, four increased, one was unchanged and six decreased. The cuts came from the top of the register. The largest holder, Polen Capital, reported 1,960,209 shares worth $740,468,936, a 6.38% portfolio weight — 42.2% of the entire cohort — and decreased its position 27.3% in the quarter. Tiger Global decreased 51.1% to 1,754,062 shares. The deepest cut in percentage terms came from Cantillon Capital, down 95.4% to 186,760 shares — a near-exit by a holder whose first-quarter pipeline row was the cohort's largest. Jensen Investment Management decreased 12.0% to 392,082 shares. Against those cuts, the cohort's two new positions were small: Appaloosa opened with 150,000 shares and Maverick Capital with 5,734 shares — together 155,734 shares, 3.4% of the cohort. The top two holders together are 80.0% of the cohort. This is a register that gained a name and lost most of its shares into a rising price.
Lens 2: institutions — more filers, 18.88% more shares
Zoom out to the whole 13F market and the register moved the other way. At June 30, 2026, 4,791 institutions reported positions in Broadcom, up from 4,577 at March 31 — a 4.7% rise — and 4,776 of them reported long positions. Reported share counts rose 18.88%, from 3,095,701,528 to 3,680,107,384 shares, with 2,135 filers entering and 1,921 exiting. The dataset's reported aggregate value rose 46.9% to $1,387,695,630,506; the aggregate includes option rows, so we treat filer and share counts as the reliable series and the dollar figure as reported (see methodology). The broad market added shares in the same quarter in which the tracked cohort removed more than half of its position.
Lens 3: the 5% register — three filings, all passive, one holder above 7%
Three SC 13D/G filings cover Broadcom — zero 13D filings and three 13G filings, from three reporting names, the most recent filed April 29, 2026. The largest row belongs to Vanguard Capital Management, which filed a new 13G reporting 354,715,196 shares (7.49%) as of March 31, 2026. The Vanguard Group reported 0 shares (0.0%) as of March 13, 2026 — the same reporting-name sequence that appeared in our Palantir, Netflix and Starbucks audits; in this ticker's parsed set there is no earlier Vanguard Group holding row, so we report the rows as filed, without summing them or calling the zero an exit. Capital International Investors reported 193,498,833 shares (4.1%) as of September 30, 2024, in a filing dated February 7, 2025 — the oldest row in this register. No 13D — the filing an investor uses when it wants something from management — has appeared at all.
Lens 4: insiders — five purchases in the entire parsed record, none by an officer
The insider lens is one-sided at scale. Across the entire parsed Form 4 record for Broadcom (96 filings through October 2, 2026), there are exactly five open-market purchase transactions — 5,550 shares for $1,926,569.27, by one buyer. Officer purchases are zero in every window: none of the five purchases was recorded as an officer transaction. Sales run the other way: 391 sale transactions totalling $1,832,331,563.14 by ten sellers across the full record, of which 287 were recorded as officer sales. In the 90 days through October 2, 2026, insiders filed seven reports covering 19 sale transactions totalling 754,080 shares and $270,247,476.82, by three sellers — and zero purchases. Over the most recent year, purchases total two transactions for $698,699.00 against 281 sales totalling $1,174,478,986.29. One disclosure about our own data: our site's insider aggregate, compiled as of October 9, 2026, shows 17 sales and $260,039,408.62 for the 90-day window, which does not match the full-parse figures; the full-parse record is primary here, and we report both rather than silently choosing one. Some selling is mechanical — vesting, tax withholding and pre-arranged plans generate filings regardless of anyone's view — and we assign no motives. What the record establishes is narrower: in the entire parsed history, Broadcom insiders bought at market price five times, for less than $2 million in total, and its officers never did.
Lens 5: Congress — four buys, two sells, and the buys are all in the House
Across the Senate and House transaction record we maintain (as of October 3, 2026), Broadcom shows four purchase transactions and two sale transactions, by two members, with the most recent purchase on August 26, 2026, and the combined record's party field listing R. The House aggregate carries all four purchases and one sale; the Senate aggregate carries zero purchases and one sale. Congressional disclosures report value ranges rather than exact amounts, so we record direction only. This is one of the few audits in this series where the congressional lens leans toward purchases — and the lean comes entirely from the House side of the record.
Lens 6: short interest — 1.09% of the share count, 26.0% below its June peak
As of September 15, 2026 — the most recent FINRA settlement date — 51,922,175 Broadcom shares were sold short, with days-to-cover of 1.7. That is 1.09% of the 4,773,629,865 shares outstanding in our fundamentals file (a share count as of August 28, 2026).
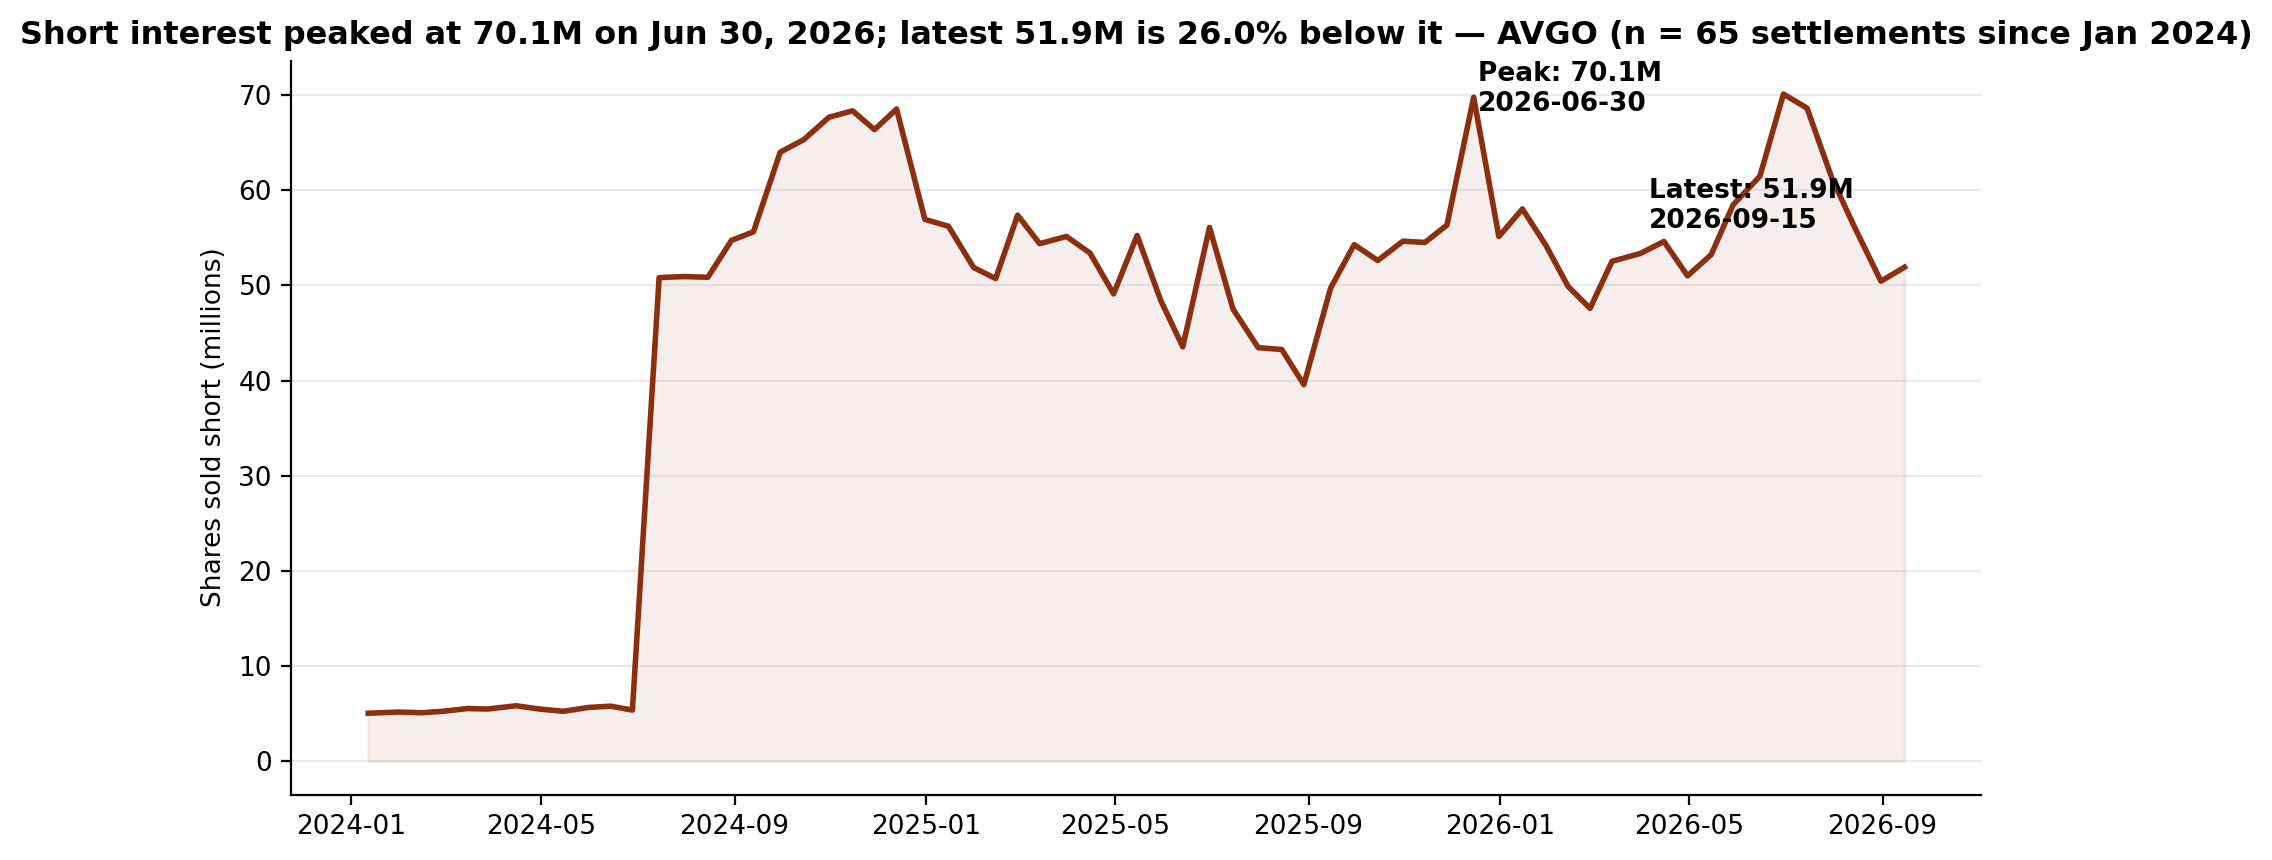
The recent settlements run 68,638,929 on July 15, then 61,196,152, 56,209,128, 50,451,889 and 51,922,175. The borrow peaked on the last day of the second quarter — the same date the superinvestor snapshot was taken — and has since eased by 26.0%. On this lens, at least, the pressure has been receding since June.
The gap, stated plainly
Broadcom's filing record splits between a broad register that added shares and a narrow register that removed most of its own. The full market expanded in the second quarter: 4,791 filers, up 4.7%, holding 3,680,107,384 shares, up 18.88%. Against that, the tracked superinvestors cut 57.9% of their shares in a quarter when the price rose 22.0% — with the holder count rising from twelve to thirteen, because the two new positions totalled 3.4% of the cohort while Cantillon cut 95.4%, Tiger Global cut 51.1% and the largest holder, Polen Capital at 42.2% of the cohort, cut 27.3%. Insiders recorded five purchases in the entire parsed record, for $1,926,569.27 and no officer purchases at all, against $1,832,331,563.14 of sales. Congress is the exception that runs the other way: four purchases against two sales, all of the purchases in the House record, the most recent on August 26, 2026. Short interest, at 1.09% of the share count, sits 26.0% below its June 30 peak — bears retreating from a small base rather than bulls arriving. One plausible reading is that the second-quarter price rise was carried by the broad register while the concentrated, named registers stood aside or stepped back, with the congressional record as the one small counterweight. The record supports each clause separately; it does not say which register is right.
What would change the picture
Nothing above is a recommendation. It is a record. These are the filings that would change the description:
- 1. The 2026Q3 13Fs (filing window closing mid-November 2026). Whether Polen Capital's 1,960,209 shares — 42.2% of the superinvestor cohort after a 27.3% cut — and Tiger Global's 1,754,062 shares survive a quarter in which the price fell 6.0% from June 30 to October 2 is the cleanest test of whether the second-quarter reduction was trimming or an exit in progress, and whether Cantillon's remaining 186,760 shares go to zero.
- 2. A first officer purchase. The parsed record holds five purchases, all by one non-officer buyer, and no officer purchases at all. A single officer purchase transaction, at any size, changes this lens from a standing near-zero to a pattern; continued silence extends a record of 391 sales against five buys.
- 3. Fiscal fourth-quarter results. The print tests the narrative the filings are arguing over: a third quarter with revenue up 85.5% and AI semiconductor revenue up 221%, fourth-quarter revenue expectations near $34.8 billion in post-results coverage, and a consensus target of $527.20 sitting above a $355.14 close in our price file.
- 4. The congressional record after four buys. Four purchases and two sales is a small sample leaning the other way from every other narrow register in this audit. The next transaction either extends that lean or balances it.
- 5. The short-interest series from its June 30 peak. The borrow peaked at 70,123,497 shares on June 30, 2026 and has since eased 26.0% to 51,922,175. Whether it rebuilds through the fourth-quarter results or keeps easing is the fastest-updating series in this audit: FINRA publishes it every two weeks.
Until one of those prints, the filing record describes a stock whose broad register added 18.88% more shares in the second quarter while its tracked superinvestors cut 57.9% of theirs into a 22.0% price rise — thirteen holders, two of them new and small, the largest holding 42.2% of the cohort — whose insiders have bought five times in the parsed record and never through an officer, and whose short borrow has been receding since June.
Related reading: Five of 83: The Superinvestors Cut Starbucks 27.8% While the Price Rose 14.1% — Filing Tape #15; Zero of 83: The Superinvestors Aren't in IREN — Filing Tape #1; 80% Overlap, No Copycat Signal: Congress vs. the Superinvestors. Broadcom's own page: Broadcom (AVGO) on GetCoattail.
Methodology and data notes
- Superinvestor lens: 83 managers collected directly from SEC EDGAR Form 13F (managers_13f collection), positions as of June 30, 2026; Broadcom identified by CUSIP 11135F101. Thirteen distinct managers hold long positions totalling 4,640,134 shares; all thirteen reported rows are long (no put or call rows). Quarter-to-quarter cohort totals (11,022,545 shares across 12 pipeline rows at March 31; 4,640,134 across 13 pipeline rows at June 30) are from the site pipeline's holdings files on the same CUSIP basis in both quarters; the change is −57.9% ((4,640,134 / 11,022,545) − 1), and the pipeline's second-quarter total agrees exactly with the EDGAR collection's long total (difference: 0 shares). Polen Capital's share of the cohort is 1,960,209 / 4,640,134 = 42.2%; the top two holders total 80.0%; the two NEW holders total 155,734 shares = 3.4%. Direction counts across the thirteen long holders: 2 new, 4 increased, 1 unchanged, 6 decreased.
- Full-market lens: SEC Form 13F Data Sets full-market aggregation (the fixtures underlying our 2026Q1–Q2 market tables). Holders = distinct filers reporting the CUSIP; 4,776 of the 4,791 reported long positions. Reported-value caution: the aggregate value ($1,387,695,630,506 over 3,680,107,384 shares) implies ≈$377.08 per share against a June 30, 2026 close of $377.75 in our price file. The aggregate sums the VALUE of every information-table row — including put and call option rows — while the share count covers long common-stock rows only, so we headline filer and share counts and label dollar values "reported."
- Insider lens: full-parse Form 4 aggregation (agg_by_ticker), record as of October 2, 2026 (96 filings). Sale and purchase counts are transaction-code counts (S and P) in non-derivative rows; grants and exercises are not counted as purchases, and one filing can contain many transaction rows. Purchase transactions total five across the full record (5,550 shares, $1,926,569.27, one buyer); officer purchases are zero in every window; officer sale transactions are 2 in 90 days, 210 in one year and 287 across the record. The site's insider aggregate (compiled as of October 9, 2026) shows a different 90-day window — 0 purchases, 17 sales, $260,039,408.62, two sellers — against the full-parse 90-day figures of 0 purchases, 19 sales and $270,247,476.82; both are reported in the article, and the full-parse record is treated as primary.
- 13D/G lens: full-parse SC 13D/G aggregation and parsed filings (3 filings matching CUSIP 11135F101, 3 reporting names), filings through April 29, 2026. Vanguard Capital Management's 354,715,196-share row (event date March 31, 2026) and The Vanguard Group's 0-share row (event date March 13, 2026) are reported as separate rows from separate reporting persons and are not summed; no earlier Vanguard Group holding row appears in this ticker's parsed set. The aggregation's totalSharesReported field sums overlapping reporters and successive amendments and is not used. Percentages are quoted exactly as reported in the respective filings.
- Congress lens: Senate PTR archive and House PTR archive as maintained on this site, combined record as of October 3, 2026. Counts are transaction counts in the aggregated member record; congressional disclosures report value ranges, so no dollar figures are used for this lens. The combined record shows four buys and two sells by two members, most recent purchase August 26, 2026, party field R; the House aggregate (as of October 3, 2026) shows four buys and one sell, and the Senate aggregate (as of October 1, 2026) shows zero buys and one sell.
- Short interest lens: FINRA Equity Short Interest files (biweekly settlement dates), collected directly from FINRA's public distribution; the Broadcom series covers 137 settlements from January 15, 2021 to September 15, 2026. The peak of 70,123,497 shares on June 30, 2026 is the peak of the full collected series. FINRA publishes each settlement about two weeks after the fact. The share-count ratio uses the fundamentals file's share count of 4,773,629,865 — a shares-outstanding count as of August 28, 2026.
- Fundamentals note: our fundamentals collection carries Broadcom's fiscal-2025 revenue of $63,887,000,000 and assets of $171,092,000,000. The same file's net-income field is labelled fiscal 2024 ($5,895,000,000), a different fiscal year from the revenue and asset fields, so no net-income figure from that file is used in this article. The fiscal third-quarter 2026 figures in the introduction are from the company's September 2, 2026 results as reported by multiple outlets (see market context sources), not from our fundamentals file. The market value of about $1.79 trillion uses that file's October 6, 2026 price ($375.81) and reported share count.
- Prices: our own daily-close file for Broadcom through October 2, 2026 ($355.14 close, +2.6% year to date on that file; 252-session closing high $481.57 on June 2, 2026; 252-session closing low $293.41 on March 30, 2026; closes of $309.51 at March 31, 2026 and $377.75 at June 30, 2026, a second-quarter change of +22.0%; change from June 30 to October 2 of −6.0% ((355.14 / 377.75) − 1)). The drawdown from the 252-session closing high is −26.3% ((355.14 / 481.57) − 1).
- Market context sources: fiscal third-quarter 2026 results (revenue $29.59 billion, up 85.5% year over year; GAAP net income $13.09 billion, up 216%; GAAP EPS $2.68 against $0.85; non-GAAP EPS $3.32 against a $3.22 consensus; AI semiconductor revenue $16.7 billion, up 221%) — company results as reported by MarketBeat, FX Leaders, KuCoin and ad-hoc-news coverage, checked October 9, 2026; fourth-quarter revenue expectations near $34.8 billion and AI semiconductor revenue near $21.7 billion — FX Leaders post-results coverage, checked October 9, 2026; October 8, 2026 decline of 4.3% to $360.14, volume of 27,027,224 shares and 52-week range of $289.96–$495.00 — MarketBeat coverage, checked October 9, 2026, with the OpenAI-related framing also in FX Leaders coverage of the same session; MarketBeat consensus target of $527.20 (41 firms, Moderate Buy, as of October 4, 2026) — The Cerbat Gem / MarketBeat, checked October 9, 2026; StockAnalysis average target of $531.31 (50 analysts) and UBS Buy reiteration with a $470 target on October 2, 2026 — StockAnalysis and Markets Insider coverage via ad-hoc-news, checked October 9, 2026; customer-chip financing reports of $50 billion to $60 billion for Anthropic and other AI customers — MarketBeat and ad-hoc-news coverage, checked October 9, 2026; quarterly dividend of $0.65 paid September 30, 2026 (record date September 21) — MarketBeat dividend coverage, checked October 9, 2026; social-media attention ranking (Broadcom fourth among meme-stock mentions in the source ranking used for this series, 103 in 24 hours, updated October 8, 2026) — AltIndex, checked October 9, 2026. Figures we could not confirm against two sources were left out.
- Broadcom is in the GetCoattail stock-page universe: Broadcom (AVGO) stock page. Series data: avgo_lens_data.csv · avgo_short_interest_series.csv. Earlier audits: Starbucks · Netflix · IREN.
This article describes public filings as of the dates stated. It is not investment advice and makes no recommendation. Filings lag reality: 13F positions are as of June 30, 2026, and later trading is not yet public.
Revision history
- v1.0 — October 9, 2026: first publication.