GetCoattail Research — The Filing Tape #122. Texas Roadhouse surfaced on a trending-stocks screen this week listed as a Strong Buy with four Buy ratings and no Hold or Sell, and the filings describe a tracked register reduced to a single small holder that trimmed into a rising price: 1 of the 147 superinvestors held the stock at June 30, 2026, totalling 2,534 shares, verified against the first quarter for a decrease of 20.5%. Insiders recorded no purchase in any window, one House member appears in the congressional aggregates, and short interest stands at 2.88% of shares outstanding, down 39.9% from June.
The Hype
Texas Roadhouse's attention this week is a screen story. The stock appeared on TipRanks' Trending Stocks by Analyst screener — SCHW, SMTC and BAC topped the page's order, followed by names already covered in this series, among them RKLB, JBHT, BNY, USB, MSFT, VSTM, BLK, UNH, ARWR, NOW and TRGP — and Texas Roadhouse followed them, listed as a Strong Buy with a price target of $211.53 (25.61% upside as printed), 4 Buy, 0 Hold and 0 Sell ratings, a printed change of -0.98%, a market value of $11.05B as printed, in Consumer Cyclical, dated October 16, 2026. TipRanks Our price file shows the path behind the screen: the stock rose 17.0% in the second quarter, from $165.14 on March 31 to $193.23 on June 30, and closed at $156.14 on October 2 — down 19.2% from the June 30 close, 27.1% below the 252-session high of $214.28 (August 12, 2026) and just 0.2% above the 252-session low of $155.88 (May 4, 2026). That is what this series checks against the filings.
The Tape
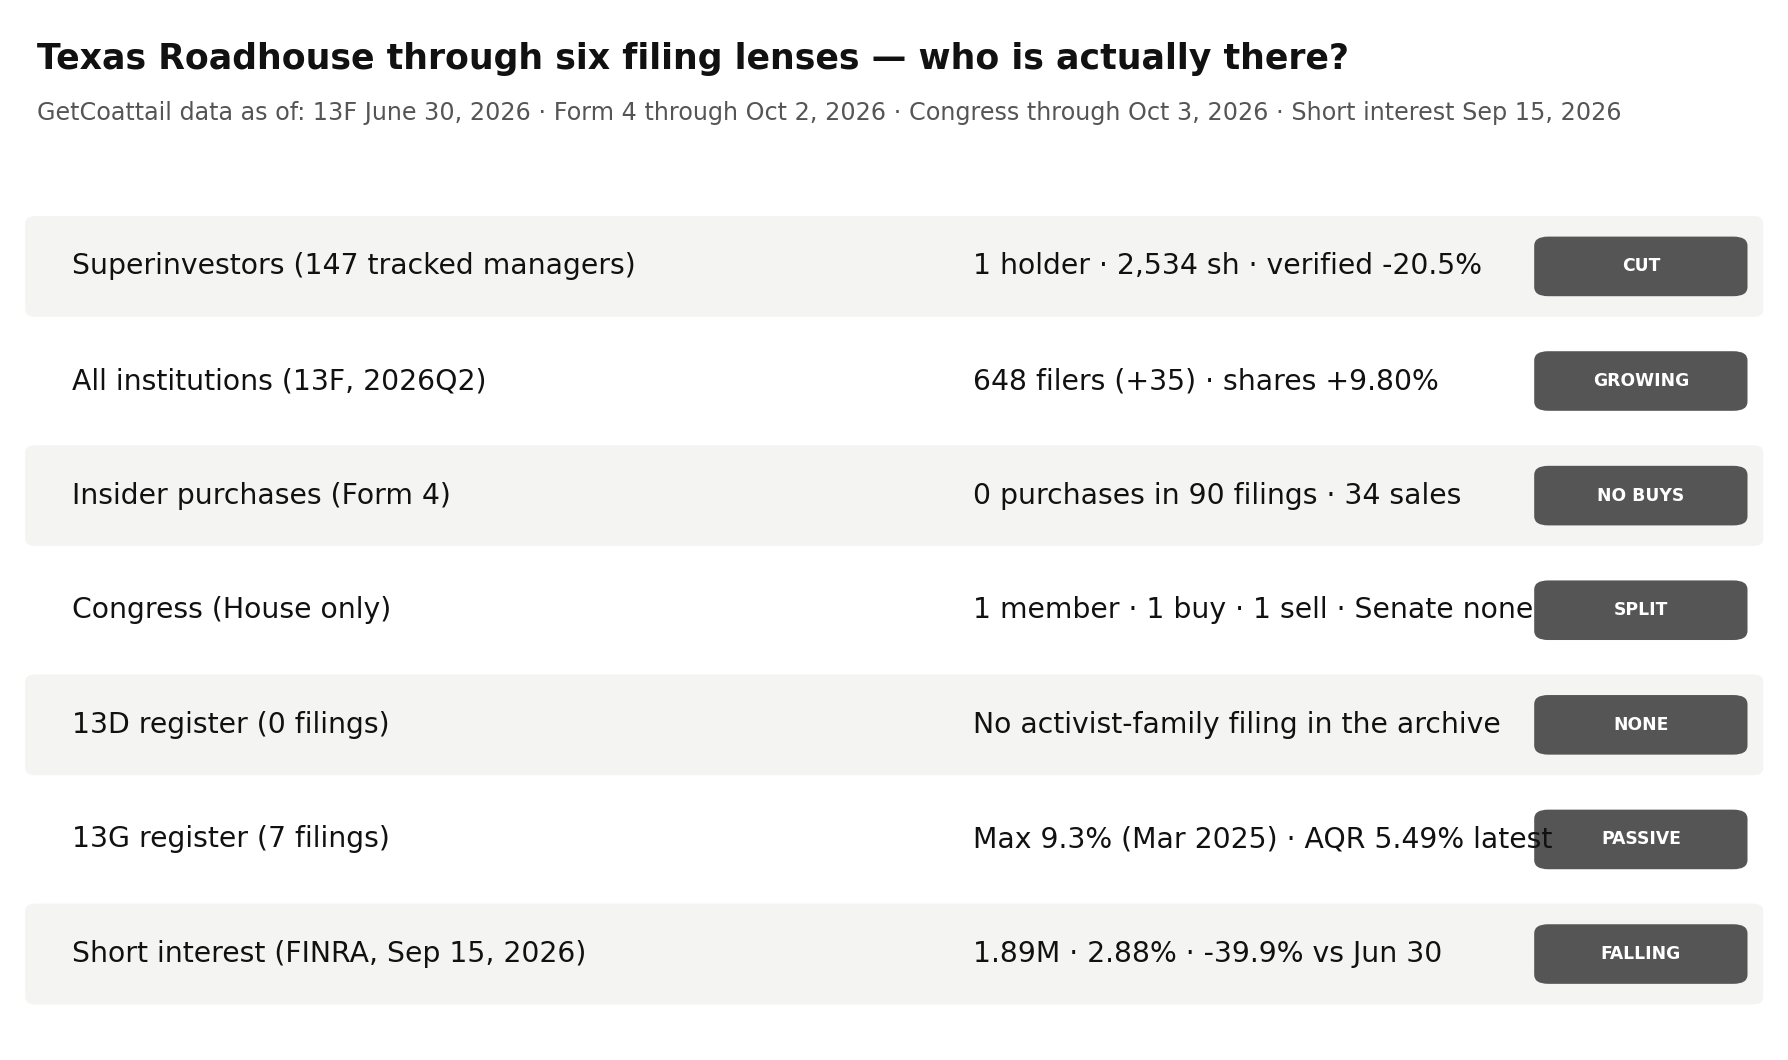
For Texas Roadhouse — the one hundred and twenty-second Filing Tape audit — the tape shows a tracked register of exactly one holder cutting a fifth of a very small position into a rising price, a full market adding filers and shares, an insider record with no purchase in any window, a single House row in the congressional aggregates, a 5% register with no activist-family filing, and a borrow that has fallen for five straight settlements.
| Lens | As of | What the filings show | Direction vs prior period |
|---|---|---|---|
| Superinvestors (13F) | Jun 30, 2026 | 1 holder of 147 tracked managers holds 2,534 shares; that holder is 100.0% of the tracked stake | 1 DECREASED; verified continuing cohort -20.5% vs Q1; no new holder; no exit; no option rows |
| All institutions (13F) | Jun 30, 2026 | 648 filers; 65,022,733 shares; reported value $11,925,886,614 | Filers +35; shares +9.80%; reported value +30.32% |
| Insiders (Form 4) | Oct 2, 2026 | No purchase in any window of the parsed record — 0 purchases in 90 filings; 34 sales | Last 90 days: 0 purchases, 7 sales; last year: 0 purchases, 21 sales |
| Congress | Oct 3, 2026 | One House member in the combined and House aggregates: 1 purchase, 1 sale; no Senate row | Last recorded purchase Jun 30, 2026 |
| 13D/G | May 15, 2026 | 7 parsed filings (0 SC 13D family, 7 SC 13G family); register maximum 9.3% | Latest filing May 15, 2026 prints AQR at 5.49%, as of Mar 31, 2026 |
| Short interest (FINRA) | Sep 15, 2026 | 1,892,223 shares; 2.88% of shares outstanding; 1.98 days to cover | Down 4.40% from the prior settlement; down 39.9% from Jun 30, 2026; down 21.6% from a year ago; no step at or above 2x in the full series |
Lens 1 — the superinvestors: one holder, the whole tracked stake, cut by a fifth. We track 149 managers whose 13F portfolios we collect from SEC EDGAR — 147 are in the collection (144 at a June 30 period-end, 3 early filers at September 30, none holding this name) — and the June 30, 2026 register for the common stock, on CUSIP 882681109, is 1 distinct manager holding 2,534 shares worth $489,645, long only, with no option rows: the single holder is labelled DECREASED. First Eagle Investment Management is that holder: 2,534 shares worth $489,645 — 100.0% of the tracked stake — at a portfolio weight that rounds to 0.0%, labelled DECREASED at -20.5% (filed August 24, 2026). There is no second tracked holder and no other CUSIP row for this issuer in the collection. The cut verifies row by row under two independent register methods that agree exactly (see methodology): the one continuing holder held 3,186 shares at March 31 and 2,534 at June 30 (-652 shares, -20.5%), with no unverified holder. No tracked manager is labelled NEW and none exited, so the register moved by the same -20.5%, from 3,186 shares to 2,534. The single row implies $193.23, the June 30 close. 13F figures are as of June 30, 2026, published up to 45 days later.
Lens 2 — institutions: 35 more filers and 9.80% more shares, while the one tracked name trimmed. At June 30, 2026, 648 institutions reported positions, up 35 from 613 at March 31 (+5.71%); 644 are long. Reported shares rose 9.80%, from 59,218,946 to 65,022,733 (+5,803,787 shares), and reported value rose 30.32% to $11,925,886,614, labelled "reported" because the aggregate includes option rows (methodology). Flow counts agree: 605 entered, 570 exited, a net of +35, and the single by-CUSIP row matches the by-ticker row on every field. One caution is larger here than in recent audits: the reported value implies $183.41 per share against a June 30 close of $193.23 (-5.08%, from the unrounded implied price), so filer and share counts are headlined and the dollar aggregate is treated as reported only.
Lens 3 — insiders: no purchase in any window, against 34 sales. The parsed Form 4 record holds 90 filings through October 2, 2026, and it contains no purchase transaction: 0 purchases, 0 buyers and 0 officer purchases in the 90-day window, the one-year window and the full record. The last 90 days hold 0 purchases and 7 sales: 21,215 shares for $4,310,991.57, by 7 sellers, 4 of them officer sale transactions, across 10 filings. The one-year window holds 21 sales (52,331 shares, $9,883,902.10, 12 sellers, 10 officer sale transactions) across 53 filings, and the full record holds 34 sales (80,298 shares, $14,849,784.02, 13 sellers, 16 officer sale transactions). The sales imply $203.20 in the 90-day window, $188.87 over one year and $184.93 over the full record, each inside that window's close range on our price file — so the dollar totals are cited for every window. The site's insider aggregate does not match the full parse's 90-day window here (methodology).
Lens 4 — Congress: one House member, one purchase and one sale, no Senate row. The combined record (as of October 3, 2026) carries one member, with 1 purchase and 1 sale, the last recorded purchase dated June 30, 2026, party recorded as D. The House aggregate (as of October 3, 2026) carries the same row, not marked as appearing in both chambers. The Senate aggregate (as of October 1, 2026) carries no row. The congressional lens here is a single House record, evenly split.
Lens 5 — the 5% register: seven filings, all passive, and a 9.3% maximum. Our full parse holds 7 SC 13D/G filings matching the site aggregate — 0 SC 13D family, 7 SC 13G family (4 SC 13G and 3 SC 13G/A); 3 amendments, 7 reporter names across 8 reporter rows. The register maximum is 9.3%: BlackRock, Inc. printed 6,202,347 shares at 9.3% as of March 31, 2025 (filed April 17, 2025, SC 13G/A), and no later BlackRock print for this name sits in the archive. The latest filing prints AQR Capital Management, LLC and AQR Capital Management Holdings, LLC at 3,616,856 shares each (5.49%) as of March 31, 2026 (filed May 15, 2026) — two reporter rows on the same stake, not two stakes. The same event date also carries Capital World Investors at 4,439,611 shares (6.7%) and Vanguard Capital Management at 3,471,520 shares (5.26%). The Vanguard Group name prints 0 shares at 0.0% as of March 13, 2026, and AllianceBernstein L.P. fell from 3,638,914 shares (5.5%) as of September 30, 2025 to 3,061,168 shares (4.6%) as of December 31, 2025. The 28,047,272-share total counts reporter rows across dates, not distinct stakes.
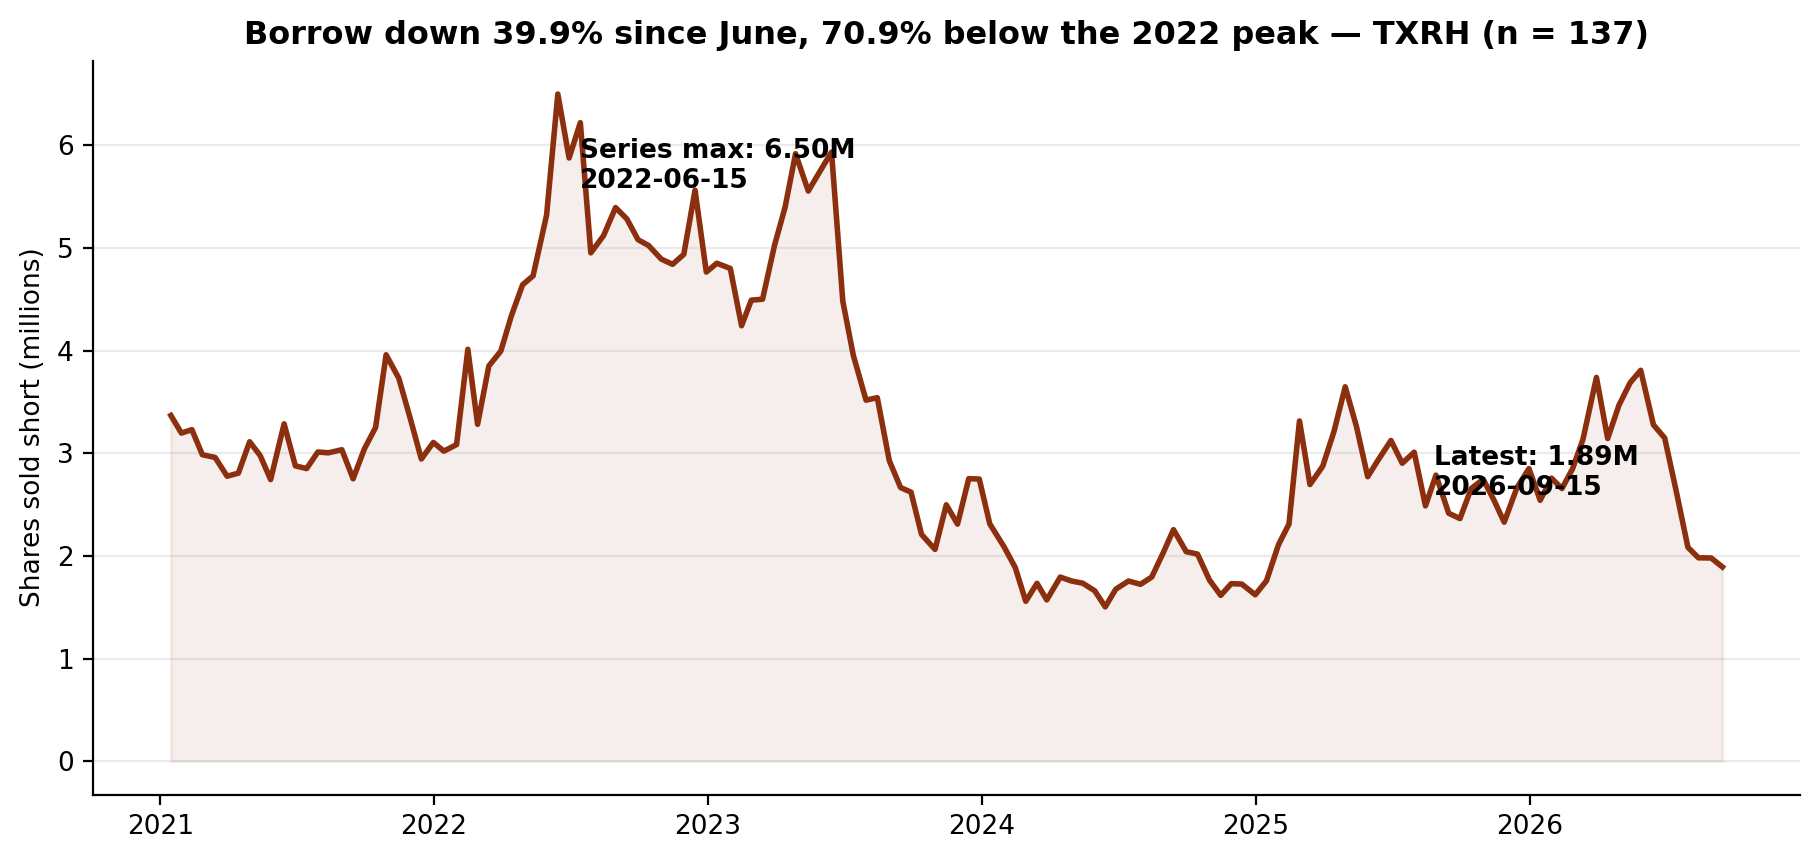
Lens 6 — short interest: a small borrow, falling for five straight settlements. The latest FINRA settlement, September 15, 2026, records 1,892,223 shares sold short — 2.88% of the 65,640,926 shares outstanding — at 1.98 days to cover, down 4.40% from the prior settlement (1,979,269 on August 31, 2026). Against the June 30, 2026 settlement (3,148,144) the latest is down 39.9%, and against the year-ago settlement (2,415,047 on September 15, 2025) down 21.6%. The series maximum across 137 settlements is 6,498,745 on June 15, 2022, so the latest sits 70.9% below that peak; the minimum is 1,503,123 on June 14, 2024. The recent path runs 3,148,144 (June 30), 2,644,856 (July 15), 2,082,848 (July 31), 1,981,249 (August 14), 1,979,269 (August 31) and 1,892,223 (September 15) — lower at every step. No step reaches 2 times in either direction (methodology); the series is published as collected.
The Gap
The narrative arriving this week is an analyst-consensus story: a Strong Buy trending listing, 4 Buy ratings against no Hold or Sell, a printed target above the last close, on a stock that rose 17.0% in the second quarter on our price file — and then fell 19.2% from that June 30 close by October 2, to within 0.2% of its 252-session low. The filings give the trend a broad base and almost no tracked one. The broad market added exposure — 35 more filers and 9.80% more shares — but the tracked register is one holder whose position rounds to a 0.0% weight, cut by a fifth during the rising quarter. The insider record runs one way: no purchase in any window of a 90-filing record, only sales. Congress is present but split — one House purchase against one House sale, nothing in the Senate — and the 5% register holds no activist-family filing. The borrow is not building against the story either: at 2.88% of the share count it has fallen at five straight settlements, 39.9% below its June level. One plausible reading is that the trending case rests on the analyst screen and the second quarter's price run, while the June tape shows the aggregate adding, the one tracked name trimming a token position, insider confirmation absent, and the clearest tracked signal being how little tracked money is here at all.
What Would Change the Picture
Nothing above is a recommendation. These filings would change it:
- 1. The 2026Q3 13F season (filing window closing mid-November 2026). The single June holder verifies, so the cohort's -20.5% is a clean baseline. Whether First Eagle's 2,534-share stake grows, shrinks or disappears after a quarter in which the price fell 19.2% from its June 30 close — and whether any second tracked manager appears — decides whether this lens stays a one-name footnote.
- 2. A first insider purchase. The parsed record holds 0 purchases in 90 filings, in every window. A first purchase would break the sales-only record.
- 3. A Senate row, or a second congressional member. The combined and House aggregates carry one member with one purchase and one sale; the Senate carries no row. A first Senate transaction, or a House record no longer evenly split, would change this lens.
- 4. A first SC 13D, or a 5% print above 9.3%. The register holds no activist-family filing, and its maximum, BlackRock's 9.3% print as of March 31, 2025, has no later print in the archive. A first activist filing, or a filing moving the maximum, would change this lens.
- 5. Short interest back through the June 2026 level, or to a new series low. The borrow stands at 1,892,223 shares, down 39.9% from June, at 2.88% of shares outstanding. A reading at or above 3,148,144 would reverse the five-settlement fall; below 1,503,123 would set a new series low.
Related reading: Five of 147: Avoro Holds 76.9% of the Tracked Arrowhead Stake, and the Verified Cohort Grew 3.3% in a Quarter When the Price Rose 30.0% — Filing Tape #121; Four of 147: Bill Nygren - Oakmark Funds Holds 67.3% of the Tracked Targa Resources Stake, and the Cohort Cut 6.4% in a Quarter When the Price Rose 6.9% — Filing Tape #120. Texas Roadhouse's own page: Texas Roadhouse (TXRH) on GetCoattail.
Methodology and data notes
- As-of & limits: The lenses rest on different clocks, none live: 13F is a June 30, 2026 snapshot published up to 45 days later; Form 4 runs through October 2, 2026; Congress aggregates run through October 3, 2026 (Senate through October 1, 2026); 13D/G through May 15, 2026; short interest through September 15, 2026; the price file ends October 2, 2026. Six limits are specific to this audit. First, the roster expanded before the recent audits — from 85 managers (83 filing) to 149 (147 filing) — so "of 147" counts are not comparable to earlier pieces' "of 83" figures. Second, the tracked collection mixes period-ends in general, but for this name the single holder sits on a June 30, 2026 period-end and none of the three September 30 early filers holds it, so every superinvestor figure here is a single-date figure. Third, the tracked stake is one holder and 2,534 shares: percentages of the tracked stake (100.0%) and of the holder's own change (-20.5%) describe a very small position, and the holder's portfolio weight rounds to 0.0%. Fourth, the full-market reported value rose 30.32% while reported shares rose 9.80%; the value implies $183.41 per share against the $193.23 June 30 close (-5.08%, computed from the unrounded implied price) — a wider gap than in recent audits — and filer and share counts are headlined. Fifth, the site's insider aggregate does not match the full parse's 90-day window for this name, detailed in the insider note below; this audit uses the full-parse numbers. Sixth, the TipRanks screener listing (dated October 16, 2026 on the page) postdates the 13F snapshot and the short-interest series; the listing is known to this audit only from outside coverage, not from our own files, and none of its price figures are cited here beyond the listing's own printed target and market value, which are reported as screen content in The Hype; every other price figure here is from our own price file.
- Superinvestor lens: 147 managers in the collection (of a 149-manager roster; 144 at a June 30, 2026 period-end and 3 early filers at September 30, 2026, none of them holding this name) collected directly from SEC EDGAR Form 13F (managers_13f collection, regenerated October 15, 2026 for the expanded roster); Texas Roadhouse positions are counted on the common-stock CUSIP 882681109, long rows only. One distinct manager holds a long position at June 30, 2026, totalling 2,534 shares worth $489,645, with a direction count of 1 DECREASED and no option rows. First Eagle Investment Management's share of the stake is 100.0% = 2,534 / 2,534, at a portfolio weight that rounds to 0.0%. The single holder is a continuing holder, and it verifies row by row against the first quarter under two independent methods that agree exactly. Under the rule used in the previous audits — a holder's first-quarter row accepted only when its implied shares-change reproduces the EDGAR shares-change label at one decimal place — the verified continuing total is 3,186 shares at March 31 moving to 2,534 at June 30 (-20.5%): First Eagle Investment Management 3,186 → 2,534 (-20.5%). Because two recent audits found the generic accession-prefix method failing on shared filing-agent prefixes, the check was also rerun identifying filings by accession (filing total equal to the manager's collection total, unique) and pairing second- and first-quarter filings of the same manager by maximum CUSIP-set overlap under the same agent prefix (First Eagle Investment Management overlap 384 CUSIPs — uniquely the maximum); the corrected method returns the identical first-quarter row, so no correction changes any figure here. The pipeline register then reconciles in both quarters (first quarter: 1 row and 3,186 shares = the verified continuing total of 3,186; second quarter: 1 row and 2,534 shares = the verified continuing 2,534; the register change is -20.5%, the same as the continuing cohort's, because there is no new holder and no exit). Implied per-share value: the single row implies $193.23, the June 30, 2026 close, so the cohort implied price is $193.23, 0.0% against the close. No tracked manager is labelled NEW for this name, and none exited.
- Full-market lens: SEC Form 13F Data Sets full-market aggregation. The primary table is the full13f collection's by-ticker file (holders = distinct filers reporting the ticker's CUSIP; 644 reported long positions out of 648 filers). Texas Roadhouse carries a single CUSIP in this aggregation (882681109), and the backfill fixtures' by-CUSIP row matches the by-ticker row exactly on every field — holders (648), long holders (644), shares (65,022,733), reported value ($11,925,886,614), prior holders (613) and prior reported value ($9,151,150,136). The by-ticker file's entered/exited fields (605 and 570, a net of +35 that matches the change in holder count) are gross flows, so this audit headlines the net change. Reported-value caution: the aggregate value ($11,925,886,614 over 65,022,733 shares) implies $183.41 per share against a June 30, 2026 close of $193.23 in our price file, a gap of -5.08% computed from the unrounded implied price. The aggregate sums the VALUE of every information-table row — including put and call option rows — while the share count covers long common-stock rows only, so we headline filer and share counts and label dollar values "reported."
- Insider lens: full-parse Form 4 aggregation (agg_by_ticker), record as of October 2, 2026 (90 filings). Sale and purchase counts are transaction-code counts (S and P) in non-derivative rows; grants and exercises are not counted as purchases, and one filing can contain many transaction rows. The 90-day window (July 5 to October 2, 2026) holds 0 purchase transactions and 7 sale transactions (21,215 shares, $4,310,991.57, 0 buyers, 7 sellers, 4 officer sale transactions) across 10 filings. The one-year window (October 3, 2025 to October 2, 2026) holds 0 purchases and 21 sales (52,331 shares, $9,883,902.10, 12 sellers, 10 officer sale transactions) across 53 filings, and the full record holds 0 purchases and 34 sales (80,298 shares, $14,849,784.02, 13 sellers, 16 officer sale transactions). The site's insider aggregate (90-day window, as of October 18, 2026) does not match the full parse's 90-day window for this name: the site aggregate shows 0 purchases, 6 sale transactions, 6 sellers and $4,228,973.79 of sale value, against the full parse's 7 sale transactions, 7 sellers and $4,310,991.57 — a difference of one sale transaction and $82,017.78. This audit uses the full-parse numbers throughout. Window price checks on our price file: the sales imply $203.20 per share in the 90-day window, inside its close range ($156.14 to $214.28); $188.87 over one year, inside its range ($155.88 to $214.28); and $184.93 over the full record, inside its full-period range — so dollar totals are cited for every window.
- 13D/G lens: full-parse SC 13D/G parsed filings (7 filings matching issuer CIK 1289460 on CUSIP 882681109: 0 SC 13D family filings, 7 SC 13G family filings — 4 SC 13G and 3 SC 13G/A, 3 of them amendments), filings through May 15, 2026. The site aggregation carries this name under a ticker-keyed row; that row (7 filings, 0 D-filings, 7 G-filings, 3 amendments, 7 reporters, latest date May 15, 2026, maximum 9.3%, total reported 28,047,272 shares) matches the parsed filings on filings, form mix, amendments, latest date, maximum and the cross-date reported total. The total sums reporter rows across filings and dates, so it is a filing-volume total, not a stake; joint reporters on one stake (AQR Capital Management, LLC and AQR Capital Management Holdings, LLC) each print the same share count and are not summed. The maximum of 9.3% is BlackRock, Inc.'s print of 6,202,347 shares as of March 31, 2025 (filed April 17, 2025, SC 13G/A); no later print under that name for this issuer sits in the archive. The latest filing prints AQR Capital Management, LLC and AQR Capital Management Holdings, LLC at 3,616,856 shares each (5.49%) as of March 31, 2026 (filed May 15, 2026, SC 13G). Other filings with a March 31, 2026 event date print Capital World Investors at 4,439,611 shares (6.7%, filed May 14, 2026) and Vanguard Capital Management at 3,471,520 shares (5.26%, filed April 30, 2026). The Vanguard Group name printed 0 shares at 0.0% as of March 13, 2026 (filed March 27, 2026); AllianceBernstein L.P. printed 3,638,914 shares (5.5%) as of September 30, 2025 and 3,061,168 shares (4.6%) as of December 31, 2025; the Vanguard names are reported exactly as they appear in each file and are not summed. The parsed coverage for this issuer holds these 7 filings; a 5% holder that has not filed in the covered window would not appear here.
- Congress lens: Senate PTR archive and House PTR archive as maintained on this site. The combined record (as of October 3, 2026) carries one member, 1 purchase transaction and 1 sale transaction, the last recorded purchase dated June 30, 2026, party D for this name; the House aggregate (as of October 3, 2026) carries the same row (one member, 1 purchase, 1 sale, last purchase June 30, 2026, party D, not marked as both chambers); the Senate aggregate (as of October 1, 2026) carries no row. The aggregates record counts and the last purchase date only; amounts and member identity are not in these aggregate files and are not stated here.
- Short interest lens: FINRA Equity Short Interest files (biweekly settlement dates), collected directly from FINRA's public distribution. This is the standard single-symbol case: the series is every row under symbol TXRH, all 137 of them under the single issuer name "Texas Roadhouse, Inc. Common S" exactly as printed in the files (the market-class column reads NNM on every row), covering 137 settlements from January 15, 2021 (3,367,714 shares) to September 15, 2026, with all 137 settlement dates distinct. The latest reading is 1,892,223 shares on September 15, 2026, down 4.40% from the prior settlement (1,979,269 on August 31, 2026), down 39.9% from the June 30, 2026 settlement of 3,148,144 and down 21.6% from the year-ago settlement of 2,415,047 on September 15, 2025, at 1.98 days to cover. The series maximum is 6,498,745 on June 15, 2022 and the series minimum is 1,503,123 on June 14, 2024. Series discontinuity check — no large step: no single-settlement step in the series reaches 2 times (the largest step is 1.435x, on February 28, 2025) and no step falls to 0.5 times or below (the smallest step is 0.755x, on June 30, 2023). Two rows in the series carry a FINRA revision flag ("R") — June 15, 2021, at 3,286,051 shares, and February 28, 2023, at 4,490,907 shares — and no row carries a stock-split flag; the flagged rows sit between ordinary readings and are not connected to any step. The full series is published as collected, with no smoothing or rebasing. The recent path runs 3,148,144 (June 30), 2,644,856 (July 15), 2,082,848 (July 31), 1,981,249 (August 14), 1,979,269 (August 31) and 1,892,223 (September 15). FINRA publishes each settlement about two weeks after the fact, so the October price action is not yet in this series. The share-count ratio (2.88%) uses the fundamentals file's shares-outstanding figure below.
- Fundamentals note: our fundamentals collection carries Texas Roadhouse's revenue of $5,878,075,000 and assets of $3,549,472,000, both sourced to the financial-series cache and both labelled fiscal 2025 — but its net income of $269,818,000 is labelled fiscal 2022 and sourced to the company-facts cache, so this name carries a fiscal-vintage split and the three figures are reported here under their own labels, not as a single-year set. The file is marked ok for this name, with no missing fields: shares outstanding of 65,640,926 (sourced in the file to the DEI entity-common-stock shares-outstanding count, with a shares-end date of July 29, 2026) and a file-computed market value of $10,736,886,746.59. The file does not flag the issuer as a foreign private issuer, and it carries SIC 5812, Retail-Eating Places, and a Nasdaq listing. The file's price for the name is $163.57 as of October 6, 2026; our daily-close file ends October 2, 2026 at $156.14, and we keep the two files' figures separate rather than blending them.
- Prices: our own daily-close file for TXRH through October 2, 2026 ($156.14 close, -5.9% year to date on that file; the 252-session closing high is $214.28 on August 12, 2026, so the last close sits 27.1% below it; the 252-session closing low is $155.88 on May 4, 2026, so the last close sits 0.2% above it; closes of $165.14 at March 31, 2026 and $193.23 at June 30, 2026, a second-quarter change of +17.0%; change from June 30 to October 2 of -19.2%; change from the September 30, 2025 close of $166.15 of -6.0%). The series in our price file begins June 1, 2021 at $98.01 and holds 1,342 rows.
- Market context sources: the TipRanks Trending Stocks by Analyst screener (full-page crawl, October 19, 2026), on which Texas Roadhouse followed SCHW, SMTC and BAC at the top of the page's order and covered names (RKLB, JBHT, BNY, USB, MSFT, VSTM, BLK, UNH, ARWR, NOW and TRGP) and skipped names (IBKR, TSM, PNC, WSE, TTE and EADSF, skipped as recorded in earlier runs and this run), and was listed as a Strong Buy with a price target of $211.53 (25.61% upside as printed), 4 Buy, 0 Hold and 0 Sell ratings, a printed change of -0.98%, a market value of $11.05B as printed, in Consumer Cyclical, dated October 16, 2026 on the page; and the Google Trends United States daily list (CyberKendra snapshot, last updated October 18, 2026, 8:22 PM IST), whose top ten were led by braces, nc state fair and jaylin noel queries and carried no single-stock query. Figures we could not confirm were left out; the external items above are reported speech from those outlets, not GetCoattail measurements, and none of their price figures are cited in this audit beyond the screener's printed target and market value as reported in The Hype.
- Texas Roadhouse is in the GetCoattail stock-page universe: Texas Roadhouse (TXRH) stock page. Series data: txrh_lens_data.csv · txrh_short_interest_series.csv. Earlier audits: Arrowhead Pharmaceuticals · Targa Resources.
Past patterns are not a promise of future results. For education only — not investment advice.
This article describes public filings as of the dates stated. It is not investment advice and makes no recommendation. Filings lag reality: 13F positions are as of June 30, 2026, and later trading is not yet public.
Revision history: v1.0 — October 19, 2026: first publication.