GetCoattail Research — The Filing Tape #175. United Airlines Holdings (UAL) reported Q3 2026 results on October 20, 2026 — record operating revenue of $17.88 billion (+17.4%), adjusted EPS $2.54 (down 8.6% year over year, missing the $2.60 consensus), fuel expense up 61.6% to $4.84 billion — and guided Q4 adjusted EPS of just $0.50–$1.50. The stock closed at $97.93 on October 23, down 29.4% from its 52-week high, while TipRanks ranks it #9 by analyst attention with 11 buy ratings and a $155.56 average price target. The filings show 5 of 147 tracked funds holding 22,032,927 shares of United Airlines common stock, $3.0 billion reported, as of June 30, 2026: Sanders Capital alone is 68.2% of that stake; the verified continuing cohort barely moved (+0.3%) in Q2; insiders have not bought a single share in the entire parsed Form 4 record while selling $65.5 million; no member of Congress reported a UAL trade; the passive 13G register's former giants are leaving (Vanguard at 0.0%, Capital International Investors down to 2.0%) while Vanguard Capital Management filed a new 7.3% 13G; and short interest has fallen 22.5% from its July peak to 5.61% of shares outstanding.
① The Hype
United Airlines had a loud week. On October 20, 2026, after the market closed, the company reported third-quarter results: operating revenue of $17.88 billion, up 17.4% from a year earlier and a quarterly record, on a record 49.5 million passengers carried. But the bottom line told a different story. Adjusted diluted earnings per share fell 8.6% to $2.54, missing the Zacks consensus estimate of $2.60 by 2.3%, as fuel expenses surged 61.6% to $4.84 billion ($3.90 per gallon) and squeezed the operating margin to 8.1% from 9.2% a year ago. On a reported basis, net income was $1.03 billion, or $3.14 per share — the gap is mostly gains on aircraft sale-leaseback transactions that management's adjusted figure strips out.
The forward look is what rattled the tape. United guided fourth-quarter revenue growth above 20% year over year, but adjusted EPS of only $0.50 to $1.50 — below expectations — assuming jet fuel averages about $4.80 a gallon. The stock jumped about 4% to $101.67 the session after the release, then faded: it closed at $97.93 on October 23.
Analysts, meanwhile, are firmly on board. On TipRanks' trending-by-analyst-attention screener, United ranks ninth: 11 buy ratings, zero holds, zero sells, a Strong Buy consensus, and an average price target of $155.56 — implying about 58.9% upside from the October 23 close.
The price, over a longer lens, tells a cooler story. That $97.93 close sits 29.4% below the 52-week high of $138.77, down 11.6% over the past month and 12.4% year to date — though still up 7.3% over six months. The question for this series is the usual one: what do the filings say?
② The Tape
We read United Airlines through GetCoattail's six filing lenses. The table summarizes; the paragraphs give the detail. Every number below comes from our pipeline, not from a press release.
| Lens | As of | What the filings show | Direction vs prior period |
|---|
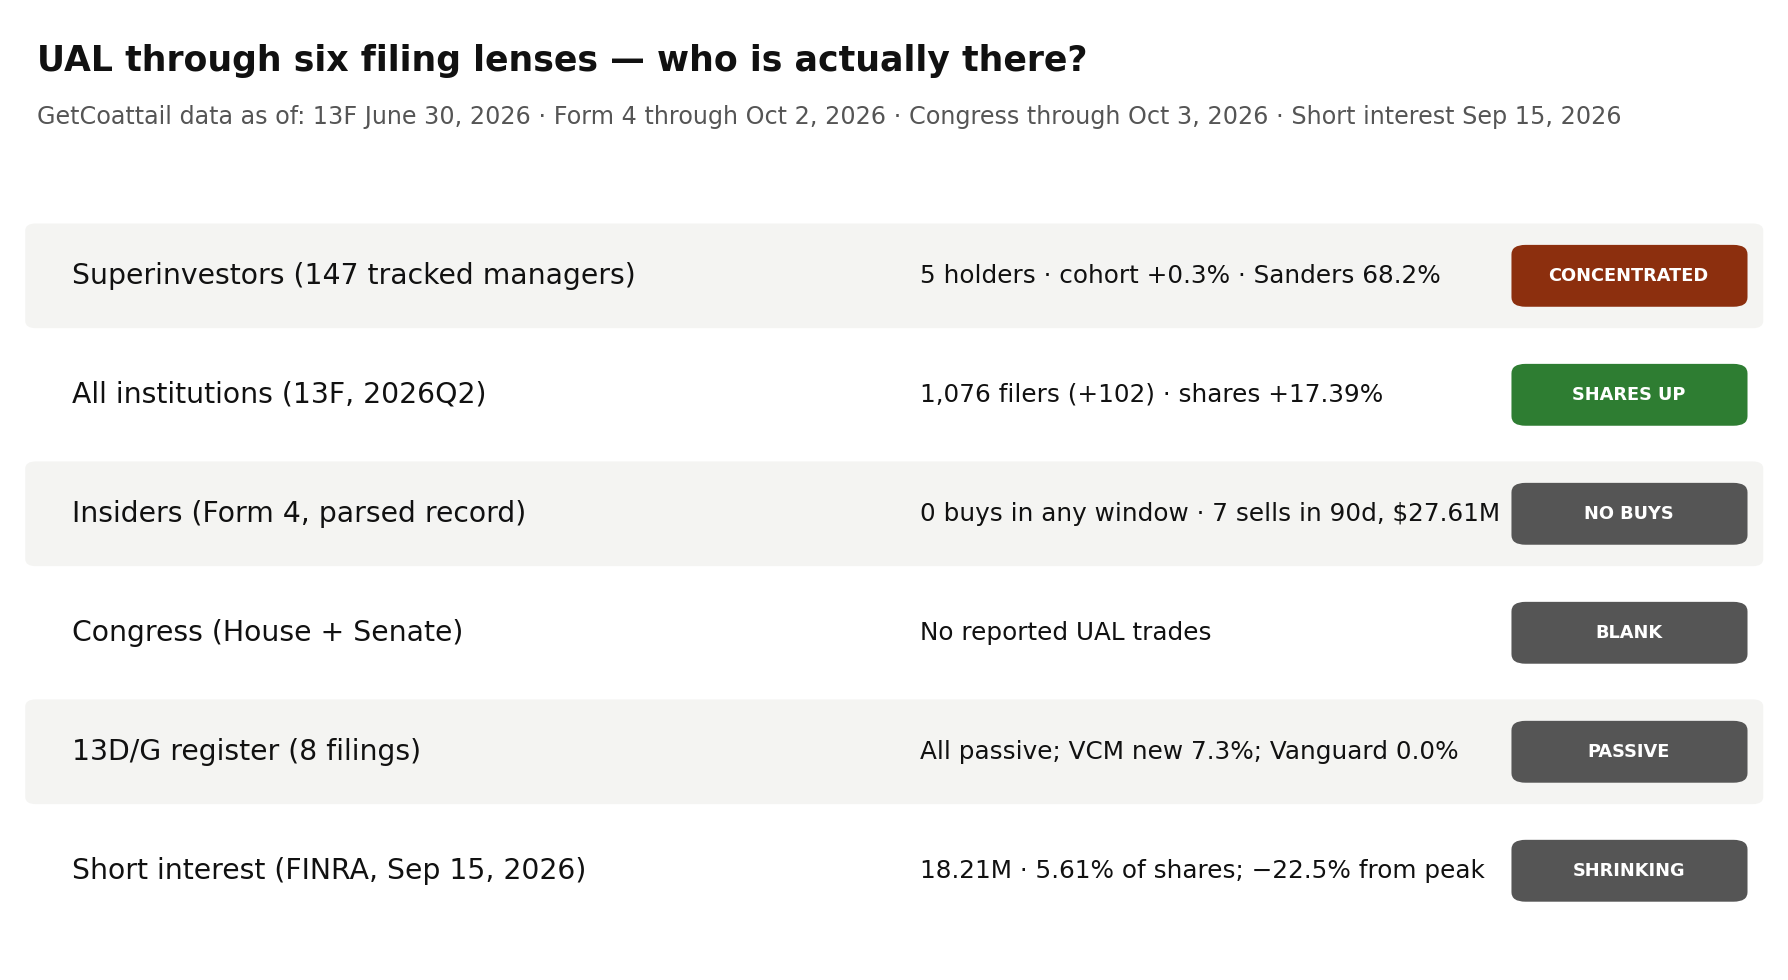
Superinvestors (13F). Five of the 147 tracked managers held United Airlines common stock on June 30, 2026 — 22,032,927 shares with a reported value of $3.0 billion. One number dominates this lens: Sanders Capital holds 15,027,948 shares, 68.2% of the entire tracked cohort's United position, at a 2.05% portfolio weight. The top two holders — Sanders plus Slate Path Capital (3,325,452 shares, 15.1%) — are 83.3% of the cohort. In other words, "the superinvestors own United" mostly means one value fund owns United.
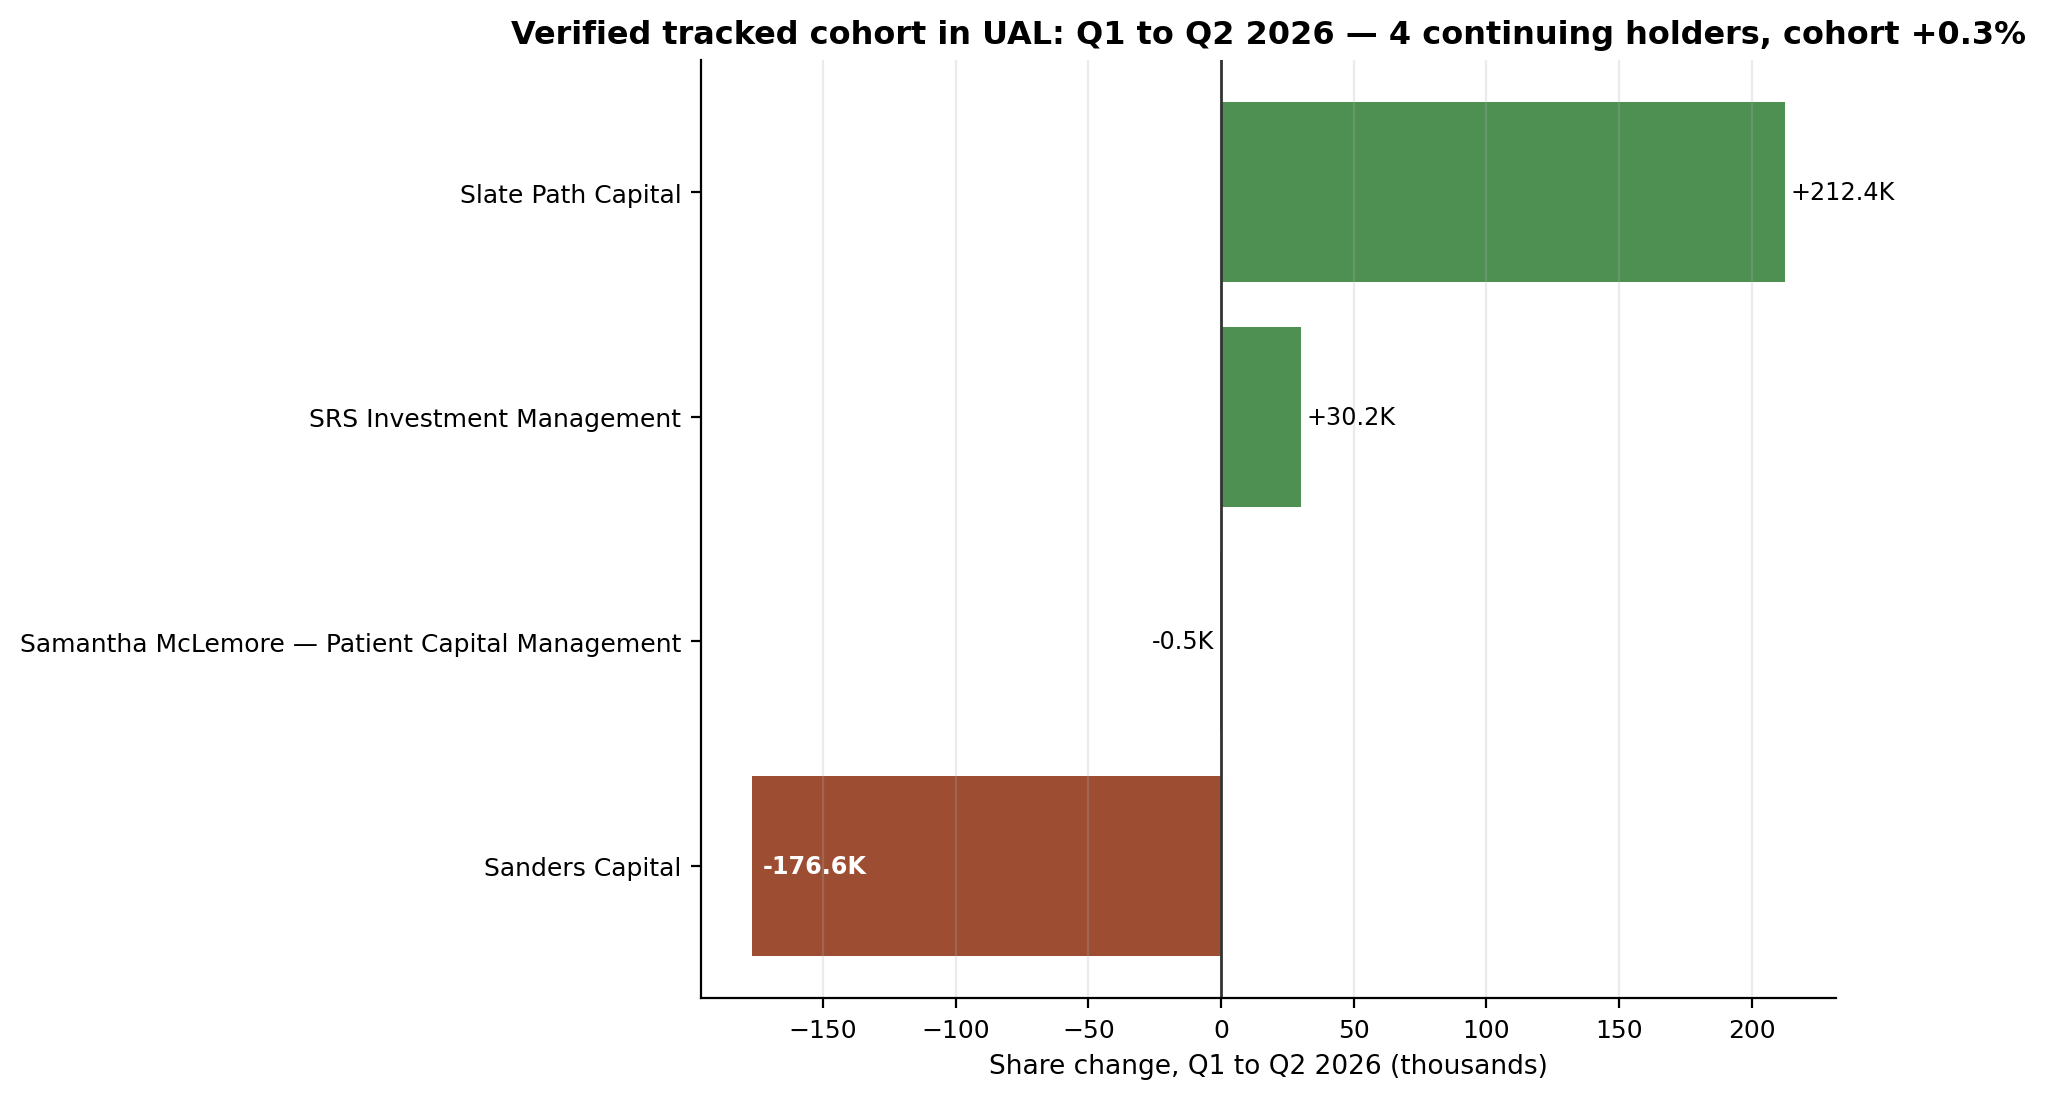
The cohort's direction was a study in stillness. The four continuing holders' verified positions moved from 21,962,107 shares at March 31 to 22,027,650 at June 30 — a gain of just 0.3% (+65,543 shares), with every holder's label recomputing exactly against the pipeline register (both quarterly registers reconcile to the share). Sanders trimmed 1.2%, Slate Path added 6.8%, SRS Investment Management added 1.0%, and Samantha McLemore's Patient Capital Management trimmed 0.1%. The one new name, Polen Capital Management, holds all of 5,277 shares — a 0.01% portfolio weight, a toe in the water. Ex-Sanders, the other four holders grew 3.6% (+242,146 shares), but the cohort's story is Sanders standing nearly still while the stock ran 47.7% in the second quarter. The cohort's 22.0 million shares are 7.63% of the full market's reported 288.9 million — a bigger slice of the register than most names in this series, concentrated in very few hands.
All institutions (13F). The full market was far more active than the tracked cohort: 1,076 filers held 288,851,098 shares ($42.1 billion reported) at June 30, up 102 filers and 17.39% in shares from March 31, with reported value up 57.4%. New filers (955) outnumbered exits (853). The broad institutional base added exposure through the quarter in which the stock rose 47.7% — then watched it fall 28.0% from the June 30 close by late October. (13F is a lagging lens: these positions are as of June 30, filed up to 45 days later.)
Insiders (Form 4). Here the record is stark. Across the entire parsed Form 4 record — 120 filings from January 3, 2025 through October 2, 2026, cross-checked filing-by-filing against the issuer's CIK with a single symbol spelling — United insiders have not bought a single share on the open market. Zero buy transactions in the last 90 days, zero in the last year, zero in the full record. What they have done is sell: 7 sales totaling $27.61 million in the last 90 days (5 sellers, all officers), 14 sales totaling $53.41 million in the last year (6 sellers), and 22 sales totaling $65.51 million across the full record (8 sellers). The largest recent sale was CEO J. Scott Kirby's: 159,321 shares at $118.05, $18.81 million, filed July 21, 2026 — about four weeks after the stock's June 26 high of $136.11. The implied average sell prices sit inside our price file's ranges for each window, so the aggregation is internally consistent.
Congress. This lens is blank, and we state that as a fact rather than leaving it out. Across the House aggregate, the Senate aggregate, the combined aggregate, and the member-level index (all through early October 2026), no member of Congress reported a UAL trade. For a stock this large and this much in the news, an empty congressional register is itself a data point.
13D/G. The passive register is where the quiet reshuffling happened. All eight parsed filings are passive 13Gs — no activist 13D anywhere in the record. But the names on the register are changing: The Vanguard Group filed an amended 13G showing 0.0 shares and 0.0% (event March 13, 2026) — it has dropped below the 5% reporting threshold. Capital International Investors fell from 6.6% (event December 2024) to 5.6% (event December 2025) to 2.0% (6.44 million shares, event March 31, 2026) — also below 5%. PRIMECAP Management slipped from 5.75% to 4.88% — below 5% as well. Against that outflow, two entries: FMR LLC (with Abigail P. Johnson co-reporting) filed a new 5.0% 13G, and Vanguard Capital Management filed a new 7.3% 13G (23.64 million shares, event March 31, 2026) — the largest current passive report in the file.
Short interest. The bears have been covering. Short interest stood at 18,214,957 shares on September 15, 2026 — 5.61% of shares outstanding, 4.83 days to cover — down 22.5% from the July 31 peak of 23,511,391 shares and down 13.1% from the June 30 settlement. It remains 22.8% above the year-ago level, so this is a partial unwind, not a capitulation.
③ The Gap
Put the market's story next to the filings and three gaps open up.
First, the analyst story versus the holder story. Eleven analysts say buy, with a $155.56 average target implying nearly 59% upside. The five tracked funds that actually held the stock through June barely moved it — +0.3% — and the one that matters, Sanders at 68.2% of the cohort, trimmed. The broad institutional market added 17.39% in shares during the quarter the stock ran 47.7%, which reads less like conviction and more like momentum-chasing into the June top; the stock has since fallen 28.0% from the June 30 close. We have not tested whether that timing gap is larger than chance, so we state it as a sequence, not a verdict.
Second, the insider story versus the outsider story. Nobody inside the company has bought a share on the open market in the 21 months our record covers — not the CEO, not a single officer — while selling $65.5 million. That does not mean the stock is mispriced; insiders sell for many reasons, including reasons that have nothing to do with valuation, and we do not speculate about motives. But it does mean the people with the best view of the fuel-cost squeeze chose, without exception, to be sellers. The $18.8 million Kirby sale on July 21 landed within weeks of the price peak — a fact about timing, not about intent.
Third, the passive register versus the price. While the stock was making its 52-week high in June, three of the largest passive holders were quietly falling below the 5% reporting threshold — Vanguard to literally 0.0%, Capital International Investors to 2.0%, PRIMECAP to 4.88%. One new large passive holder entered (Vanguard Capital Management at 7.3%). Net, the 13G register got smaller and more concentrated even as the full 13F filer count grew by 102. None of this is a recommendation. It is a record — and the record says the quarter's biggest buyers were the broad institutional crowd arriving as the price peaked, while the tracked smart-money cohort, the insiders, and three large passive holders were standing still, selling, or leaving.
④ What Would Change the Picture
Nothing above is a recommendation. It is a record. Here is what would change it, all observable in future filings:
- 1. Sanders Capital's Q3 13F. At 68.2% of the tracked cohort, Sanders is the cohort's United position. Any meaningful add or cut in the Q3 filing (due by November 16, 2026) moves the whole picture — watch whether the trim continues or reverses.
- 2. The first insider buy. A single open-market purchase by any officer in the Form 4 feed would break a 21-month pattern of sells-only. Until then, the "never bought" fact stands.
- 3. An activist 13D. The 13D/G register is 100% passive today. Any 13D filing would be a regime change in the holder base worth its own update.
- 4. The Q3 full-market 13F. Did the 1,076 filers who added 17.39% in Q2 hold through the 28% drawdown, or did the September quarter show the exits? The Q3 13F season closes November 16.
- 5. Short interest rebuilding. The unwind from the July peak (−22.5%) could resume if the Q4 fuel guidance proves right; the next settlements will show whether the August dip to 17.4 million shares was the floor.
⑤ As-of & Limits
| Lens | As of | Coverage note |
|---|
13F figures are as of June 30, 2026, the quarter-end. Funds have up to 45 days after quarter-end to file, so this is the most recent complete picture — and it is always a lagging one. The Q3 2026 filing season closes November 16, 2026, when this tape gets its update. Form 4 and congressional aggregates reflect our collection cutoffs, not the companies' or members' latest activity. Short interest is reported by FINRA on a twice-monthly settlement cycle. We do not estimate missing lenses: Congress has no UAL rows in any of our aggregates, and we report that blank rather than filling it.
---
Methodology & data. All figures are computed from GetCoattail's collections of SEC EDGAR filings (13F-HR, Form 4, SC 13D/G), congressional transaction disclosures (House PTR, Senate), and FINRA short-interest settlements. Superinvestor counts use the 147-manager Q2 2026 collection (144 filers at June 30, 2026; 3 early filers at September 30, 2026 — none holds UAL). "Verified continuing cohort" means Q1→Q2 positions re-paired by filing accession identity and CUSIP-overlap scoring, with every change label recomputed from the pipeline register; both quarterly registers reconcile to the share. Full-market 13F values are reported (including option rows); the primary indicators are filer and share counts. Form 4 aggregates count open-market purchase (P) and sale (S) codes only. Download the underlying series: ual_lens_data.csv · ual_short_interest_series.csv. Related: The Filing Tape #174 — ABT · The Filing Tape #173 — ADI · How we track 13F filings. Past patterns are not a promise of future results. For education only — not investment advice.
This article describes disclosed positions and transactions. It does not recommend buying, selling, or holding any security.
Revision history: v1.0 — October 24, 2026.