Follow-up to Filing Tape #145 (Powell Industries): this study tests whether adding a third supply signal strengthens the two-signal result.
- Window: 9,261 settlement prints, publication dates from July 15, 2023 (17,783 source prints; 8,522 pre-window excluded).
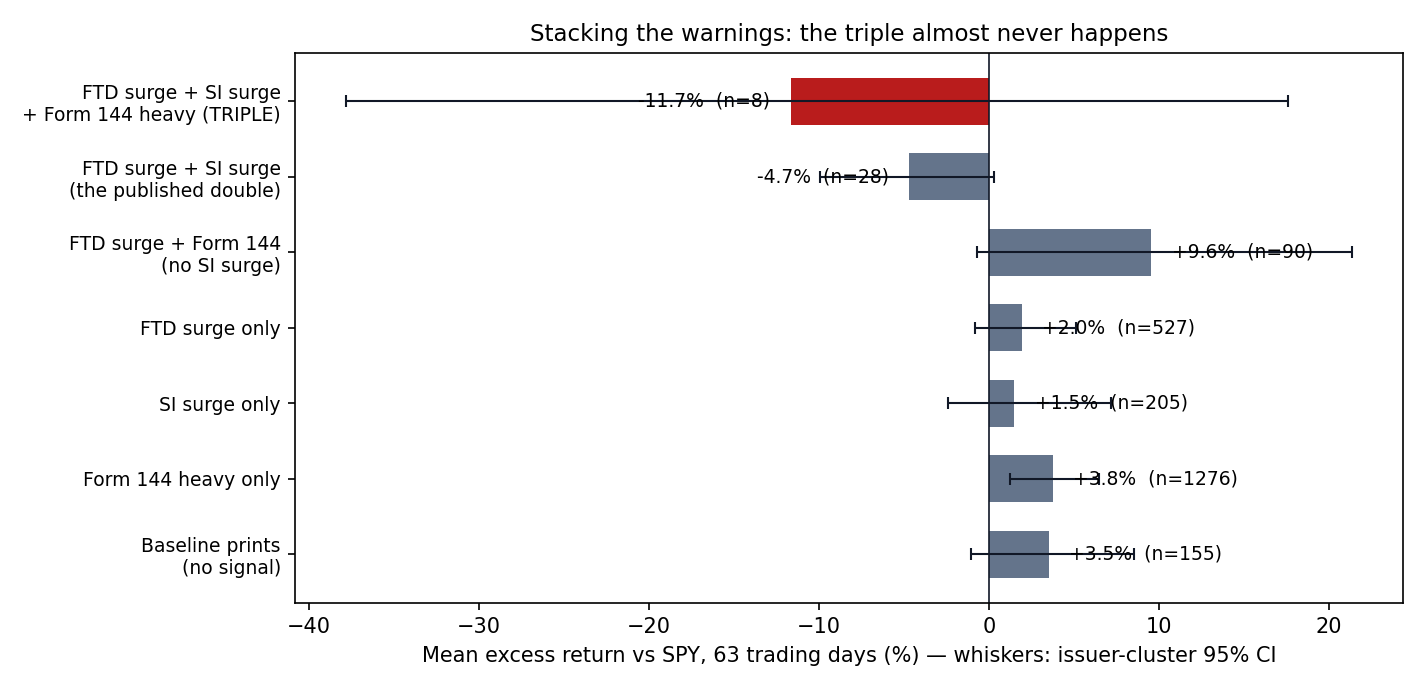
- Triple: 8 events at 8 tickers — mean −11.66% vs SPY at 63 days, median −17.19%, 2 of 8 positive; issuer-cluster 95% CI [−37.8, +17.6].
- Primary contrast: triple minus double −6.99pp, CI [−33.0, +24.5] — the third signal’s added value cannot be measured.
- Double without the third leg: −4.67% (28 scored prints), vs −5.14% published for the full window.
- Form 144 alone: +3.78% (1,276 scored prints) — notices alone are not the warning.
- Rarity: only 20% of double surges (8 of 40) carried heavy Form 144 supply.
We pre-registered the test before running it, fixed the definitions in advance, and counted. The honest answer is that the third alarm almost never rings — and on the eight occasions in three years when it did, the sample is too small to say anything stronger than that.
How the test was built
The event base is the same one used in the published fails-to-deliver study: settlement prints for a 1,633-ticker price universe, with entry only after each print’s publication proxy date, and returns measured as excess over SPY at 21, 42 and 63 trading days. Nothing about the first two signals was redefined. A fails-to-deliver surge means the print’s fail group rose 50% or more against the previous print, with both prints at or above 10,000 fails. A short-interest surge means FINRA short interest rose 50% or more at the same settlement print.
The third leg is new, and its definition was fixed before computation. A stock carries heavy Form 144 supply at a print if notices filed at that ticker in the 90 days ending on the print’s publication proxy date add up to at least $10 million in noticed value, or to shares amounting to at least 0.1% of the shares outstanding reported across those notices. Only notices filed on or before the publication date count — a reader standing at that print could have seen every input used here.
The window starts with publication dates on or after July 15, 2023, so that every 90-day notice window sits fully inside the era of mandatory electronic Form 144 filing, which began on April 13, 2023. Of 17,783 prints in the source file, 8,522 fall before the window and are excluded from every cell — not treated as “no notice,” simply out of scope. That leaves 9,261 prints. Everything below is drawn from those 9,261.
The count is the finding
Of the 9,261 prints, 40 were double surges — fails-to-deliver and short interest rising together. Of those 40, eight also carried heavy Form 144 supply. Eight events, at eight different tickers, in three years.
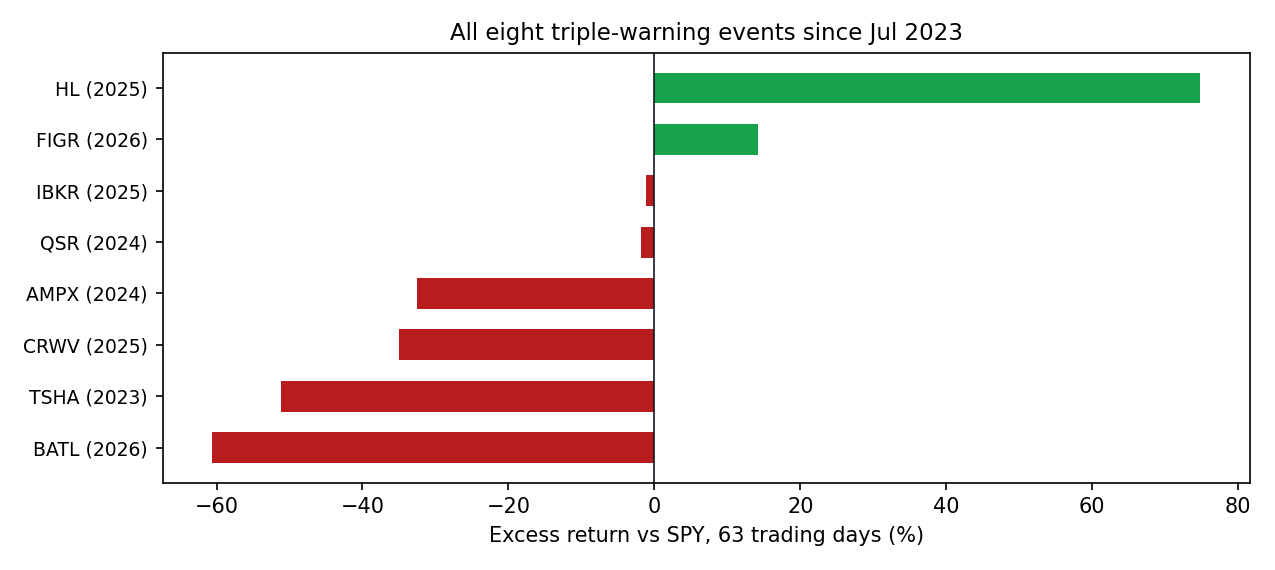
Those eight averaged −11.66% against SPY over 63 trading days, with a median of −17.19%, and two of the eight finished positive. Read on its own, −11.66% looks like a verdict. It is not one. The issuer-cluster 95% confidence interval for the eight runs from −37.8% to +17.6% — it contains zero, and it contains strongly positive outcomes too. The pre-registered primary contrast, the triple cell minus the double cell, is −6.99 percentage points with a confidence interval of [−33.0, +24.5]. An interval that spans 57 points does not measure an effect; it measures our ignorance, and we report it as such.
Our specification fixed the consequence in advance. If the triple cell’s scored sample fell below 30 events, the headline conclusion would be “too rare to read”: report the count and the descriptives, and make no strength claim in either direction. The sample is eight. The rule fires. The triple is a watchlist screen — a combination worth a human look when it appears — not a statistic anyone should size a position on.
For the record, the eight cases were Battalion Oil (BATL, −60.6% over the following 63 trading days), Taysha Gene Therapies (TSHA, −51.2%), CoreWeave (CRWV, −35.0%), Amprius Technologies (AMPX, −32.5%), Restaurant Brands International (QSR, −1.9%), Interactive Brokers (IBKR, −1.1%), Figure Technology Solutions (FIGR, +14.2%) and Hecla Mining (HL, +74.8%). Six fell, two rose sharply. That is what an n of eight looks like: a list, not a law.
The grid’s second lesson runs the other way
The full two-by-two-by-two grid holds a result that is better supported than the headline, because its cells are larger. Heavy Form 144 supply by itself was followed by positive average excess returns in every cell that did not also contain the settlement stress: +3.78% when it appeared alone (1,276 scored prints), +9.56% alongside a fails-to-deliver surge without a short-interest surge (90 prints), and +17.18% for short-interest surge with heavy notices but no fails surge (14 prints). The double-surge cell without the third leg averaged −4.67% in this restricted window (28 scored prints) — directionally consistent with the −5.14% the full-window study published, though its in-window interval now grazes zero at [−9.9, +0.3].
In other words, the bearish weight in this grid sits in the settlement prints — shares undelivered and short interest building at the same moment — not in the notices. That division of labour is the same one our other Form 144 work keeps finding from the opposite direction. Our census of all 63,013 electronic Form 144 filings showed that roughly 84% of noticed sales do execute within 90 days, so the notices are real supply; but the collision study — Form 144 supply arriving alongside insider buying — found that pure supply on its own carried no measurable forward penalty either. A notice says someone intends to sell, most of it under pre-arranged plans. It does not say the market is failing to absorb the sale. The settlement data is where absorption failure would show up, and that is where the negative cell lives.
What this does not say
It does not say three warnings are worse than two. The interval on that comparison spans from −33 to +25 percentage points, and claiming either direction from it would be inventing precision the filings do not contain. It does not say any individual stock showing all three signals will fall — two of the eight rose, one of them by 74.8%. It makes no tradability claim: no borrow costs, no transaction costs, and no causal reading are modelled anywhere in this study. And it inherits the limits of its sources, including gaps in the SEC’s 2026 fails-to-deliver files and the coverage of the 1,633-ticker price universe.
What it does say is narrower, and we think more useful. A signal combination that sounds like a siren — undelivered shares, surging short interest, and seven or eight figures of noticed insider supply at the same time — occurred eight times in 9,261 prints. Anyone selling certainty about what that combination means is working from a sample that cannot carry the claim. When the third alarm does ring, the correct response is to open the filings and read them, not to quote an average built on eight observations. The rarity is the result, and we would rather publish the rarity than dress it up as an edge.
Methodology
Methodology: Pre-registered specification dated October 20, 2026, fixed before computation. Event base and returns reused unchanged from the published fails-to-deliver study (settlement prints, 1,633-ticker price universe, entry after publication proxy date, excess return vs SPY). Form 144 leg computed from the full electronic-filing census (63,013 notices from April 13, 2023); heavy supply defined as notices in the trailing 90 days aggregating to at least $10 million in value or at least 0.1% of shares outstanding (summed units divided by the maximum units-outstanding figure reported among the window’s notices). Analysis window: publication proxy dates from July 15, 2023; 17,783 source prints, 8,522 excluded as pre-window, 9,261 in window. Confidence intervals are issuer-cluster bootstrap 95% intervals. An independent recomputation from the raw sources reproduced every figure in this article with zero discrepancies. The full 9,261-row event file (events_trio.csv) accompanies this article as public data. For education only. Not investment advice.
Data download
Full event file — all 9,261 in-window prints with flags and 21/42/63-day excess returns: events_trio.csv.
Revision history
October 29, 2026: First published.