GetCoattail Research — The Filing Tape #111. Workday topped a TipRanks trending-stocks list this week after Rising 2026 and its Analyst Day, and the filings describe a register rebuilt from the top: 9 of the 147 superinvestors we track hold the stock at June 30, the top two at 77.3% of that stake, two positions labelled new and both register-verified as new, insiders with no purchase in 172 filings, and short interest down 52.3% from a June 30 series peak.
The Hype
Workday's attention this week is an analyst-attention story. The stock led TipRanks' "3 Trending Stocks Analysts Are Watching and Why, October 16" — published October 16, 2026 — ahead of Domino's Pizza and JPMorgan Chase, after 14 analyst ratings landed within 72 hours around Workday Rising 2026 and its Analyst Day, where fiscal 2028 targets were maintained; it is the highest-ranked uncovered name there. Our price file describes a stock that fell, then ran: it slipped 5.8% in the second quarter, from $129.92 on March 31 to $122.42 on June 30, then rose 52.1% after quarter-end to close at $186.14 on October 2 — still down 13.3% year to date, 24.2% below the 252-session closing high of $245.67 (October 21, 2025) and 65.5% above the 252-session low of $112.50 (April 10, 2026).
The Tape
For Workday — the one hundred and eleventh Filing Tape audit — the tape shows a nine-holder cohort concentrated in two names at 77.3% and growing 10.0% on its verified core, two new positions both register-verified, a full market holding 22.00% more shares with five fewer filers, no insider purchase in the record against 446 sales, a congressional lens with a single House member, fourteen passive 5% filings headed by 19.3%, and a borrow at 5.34% of shares outstanding, down 52.3% from its June 30 peak.
| Lens | As of | What the filings show | Direction vs prior period |
|---|---|---|---|
| Superinvestors (13F) | Jun 30, 2026 | 9 holders of 147 tracked managers; 26,061,476 shares; the top holder is 43.4% of that stake | 5 INCREASED, 2 NEW, 2 DECREASED; verified continuing holders +10.0% vs Q1; 1 exit |
| All institutions (13F) | Jun 30, 2026 | 922 filers; 206,575,322 shares; reported value $26,181,042,667 | Filers -5 (-0.54%); shares +22.00%; reported value +16.62% |
| Insiders (Form 4) | Oct 2, 2026 | No purchase in the full parsed record of 172 filings; 446 sales | Last 90 days: 0 purchases, 79 sales; last year: 0 purchases, 281 sales |
| Congress | Oct 3, 2026 | 1 member; 1 purchase, 3 sales; last purchase Aug 18, 2026 | All in the House aggregate; no Senate row |
| 13D/G | Sep 4, 2026 | 14 parsed filings, all 13G family (4 SC 13G, 10 SC 13G/A); register maximum 19.3% (David A. Duffield) | Latest filing reports BlackRock, Inc. as of Aug 31, 2026 |
| Short interest (FINRA) | Sep 15, 2026 | 14,145,081 shares; 5.34% of shares outstanding; 5.42 days to cover | Down 17.0% from the prior settlement; down 52.3% since Jun 30, 2026 |
Lens 1 — the superinvestors: nine holders, the top two at 77.3%, a growing verified core, and two new labels that both verify. We track 149 managers whose 13F portfolios we collect from SEC EDGAR — 147 are in the collection: 144 at a June 30 period-end and 3 early filers at September 30, none holding this name. At June 30, 2026, nine holders total 26,061,476 shares worth $3,190,445,966, long only, with no option row, all on the single CUSIP 98138H101. Eagle Capital Management is the top holder at 43.4%: 11,323,681 shares worth $1,386,245,000 — at a 4.23% portfolio weight, increased 30.1%. First Eagle Investment Management holds 8,824,517 shares worth $1,080,297,413 — 33.9% of the cohort — at a 1.78% weight, up 16.0%; the top two together are 77.3% of the cohort. Generation Investment Management holds 2,311,084 shares ($282,922,903), down 44.7% at a 2.75% weight; Bristol (John W. Bristol & Co.) 721,421 shares ($88,316,359), down 0.8% at a 1.31% weight; Mondrian Investment Partners 652,660 shares ($79,898,637), up 6.2% at a 1.23% weight; Bill Nygren - Oakmark Funds 192,764 shares ($23,598,169), up 1552.2% at a 0.03% weight; Arnold Van Den Berg - Century Management 48,837 shares ($5,978,626), up 28.9% at a 1.26% weight. The seven continuing holders all verify row by row against the first quarter, moving from 21,888,932 shares at March 31 to 24,074,964 at June 30 (+2,186,032 shares, +10.0%). One tracked manager exited: Skye Global Management, whose first-quarter register row held 52,600 shares. Two holders carry the collection's NEW label — Richard Pzena - Pzena Investment Management at 1,971,270 shares worth $241,322,874 (7.6% of the cohort, a 0.71% weight) and GQG Partners at 15,242 shares worth $1,865,985 (0.1% of the cohort) — and both verify against the register: neither prefix carries a first-quarter row for this name, so both positions opened in the quarter. All nine rows imply exactly $122.42, the June 30 close. 13F figures are as of June 30, 2026, and are published up to 45 days later.
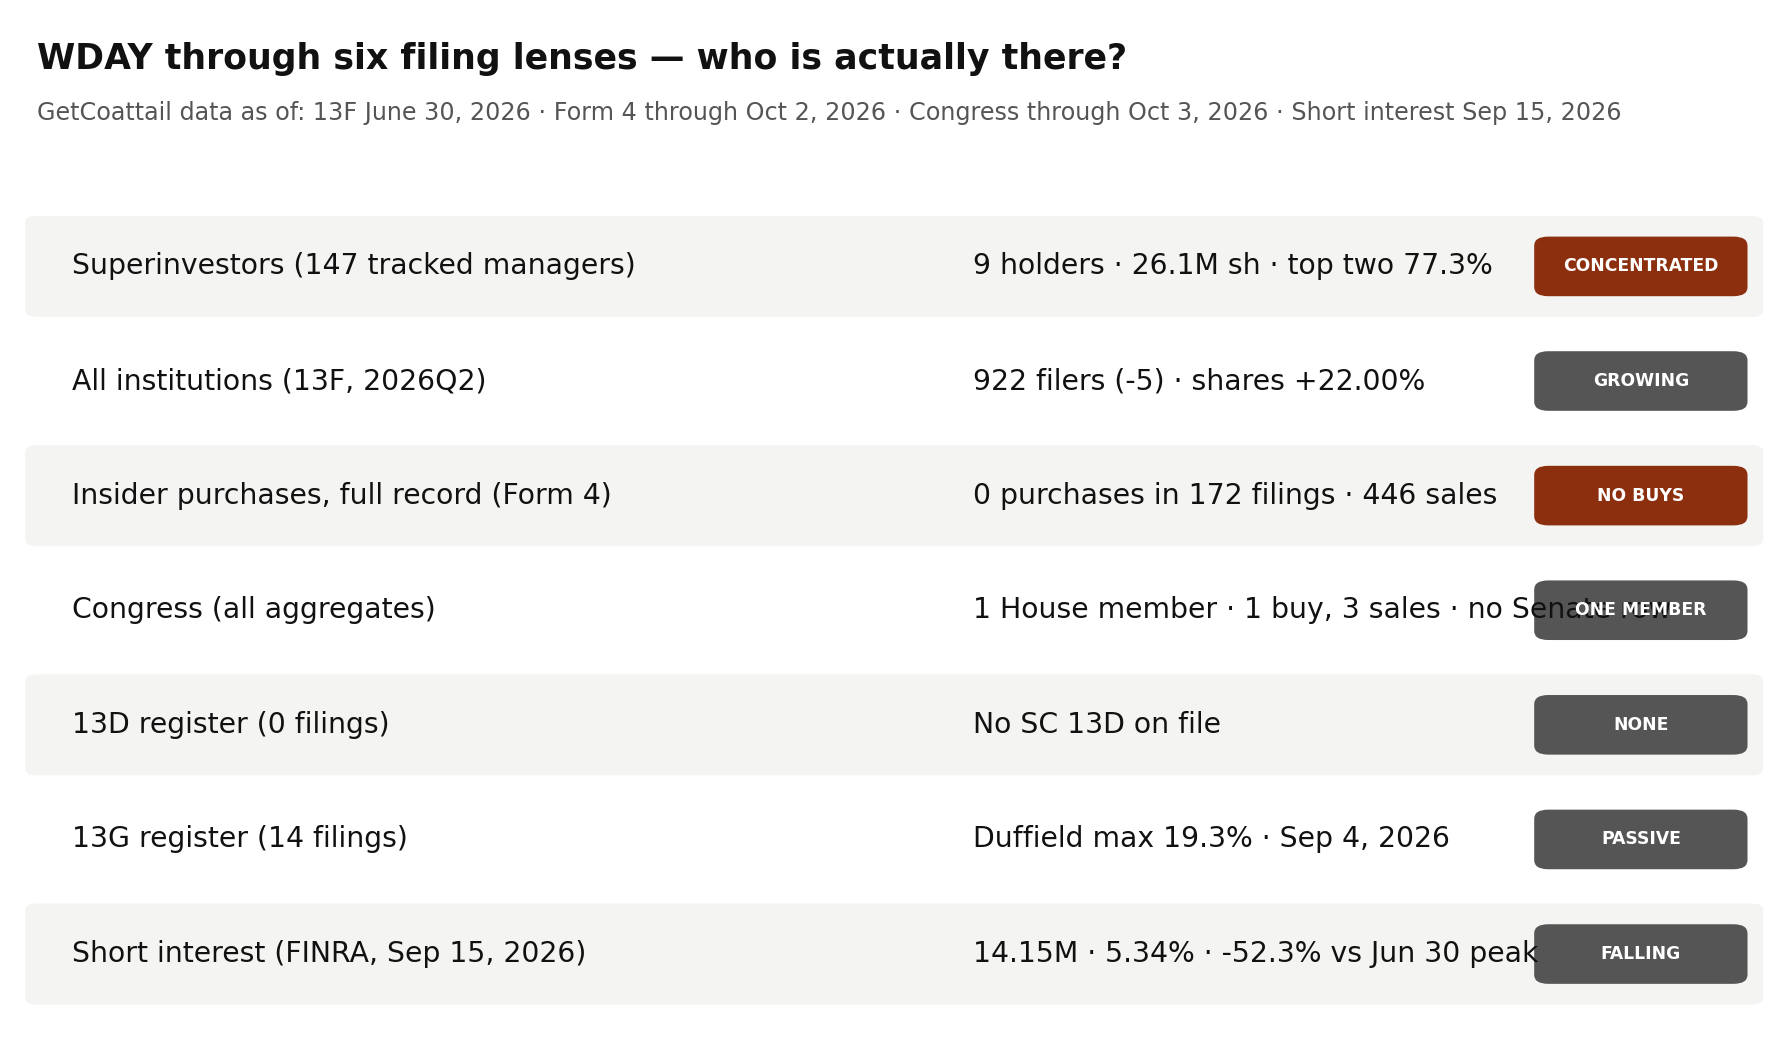
Lens 2 — institutions: fewer filers holding many more shares, at a higher reported value. At June 30, 2026, 922 institutions reported positions, down 5 from 927 at March 31 (-0.54%); 908 are long. Reported shares rose 22.00%, from 169,323,330 to 206,575,322 (+37,251,992 shares), and reported value rose 16.62% to $26,181,042,667, from $22,449,349,119, labelled "reported" because the aggregate includes option rows (see methodology). That value implies $126.74 per share against a June 30 close of $122.42, a gap of +3.53%.
Lens 3 — insiders: no purchase in the full record, against 446 sales. The parsed Form 4 record holds 172 filings through October 2, 2026. The last 90 days hold no purchase transaction at all against 79 sales: 905,594 shares for $161,617,526.52, by 5 sellers, 15 of them officer sale transactions, across 19 filings. The one-year window holds no purchase transaction at all against 281 sales: 3,484,335 shares for $555,432,330.56, by 8 sellers, 62 of them officer sales, across 99 filings. Across the full record: no purchase transaction in 172 filings — no buyer at all, and no officer purchase transaction in any window — against 446 sales totalling 4,786,608 shares for $869,485,879.97, by 11 sellers, 97 of them officer sales. Every window prices inside its range — 90-day sales imply $178.47, one-year sales $159.41, full-record sales $181.65 — so dollar totals are cited for every window.
Lens 4 — Congress: one member, in the House only. The combined record (as of October 3, 2026) carries 1 member with 1 purchase transaction and 3 sale transactions, the last purchase dated August 18, 2026, the member's party recorded as D. The House aggregate carries the same row; the Senate aggregate (as of October 1, 2026) carries no row for this name, so every recorded transaction sits in the House archive.
Lens 5 — the 5% register: fourteen filings, all passive, headed by a founder print at 19.3%. Our full parse holds 14 SC 13D/G filings matching the site aggregate — 4 SC 13G and 10 SC 13G/A, 10 amendments, 7 reporter names in 14 reporter rows, no 13D at all. The register maximum is 19.3%: David A. Duffield reports 51,191,345 shares as of December 31, 2024 (filed February 12, 2025, SC 13G/A). The latest filing is a BlackRock, Inc. SC 13G/A, filed September 4, 2026: 19,666,221 shares (10.0%) as of August 31, 2026. The remaining rows: The Vanguard Group at 20,142,800 shares (9.41%), Dec 31, 2024, 21,799,056 shares (10.04%), Sep 30, 2025, 25,009,288 shares (11.74%), Dec 31, 2025 and 0 shares (0.0%), Mar 13, 2026; BlackRock, Inc. at 17,540,102 shares (8.2%), Dec 31, 2024 and 19,580,021 shares (9.7%), Jun 30, 2026; David A. Duffield at 49,350,689 shares (19.01%), Dec 31, 2025; Hotchkis and Wiley Capital Management, LLC at 10,655,733 shares (5.07%), Mar 31, 2026 and 12,679,129 shares (6.31%), Jun 30, 2026; Vanguard Portfolio Management at 11,704,297 shares (5.57%), Mar 31, 2026; Vanguard Capital Management at 15,944,978 shares (7.59%), Mar 31, 2026; and Eagle Capital Management, LLC at 11,323,681 shares (5.63%), Jun 30, 2026 — the top holder's count. The 286,587,340-share total counts reporter rows across dates, not distinct stakes.
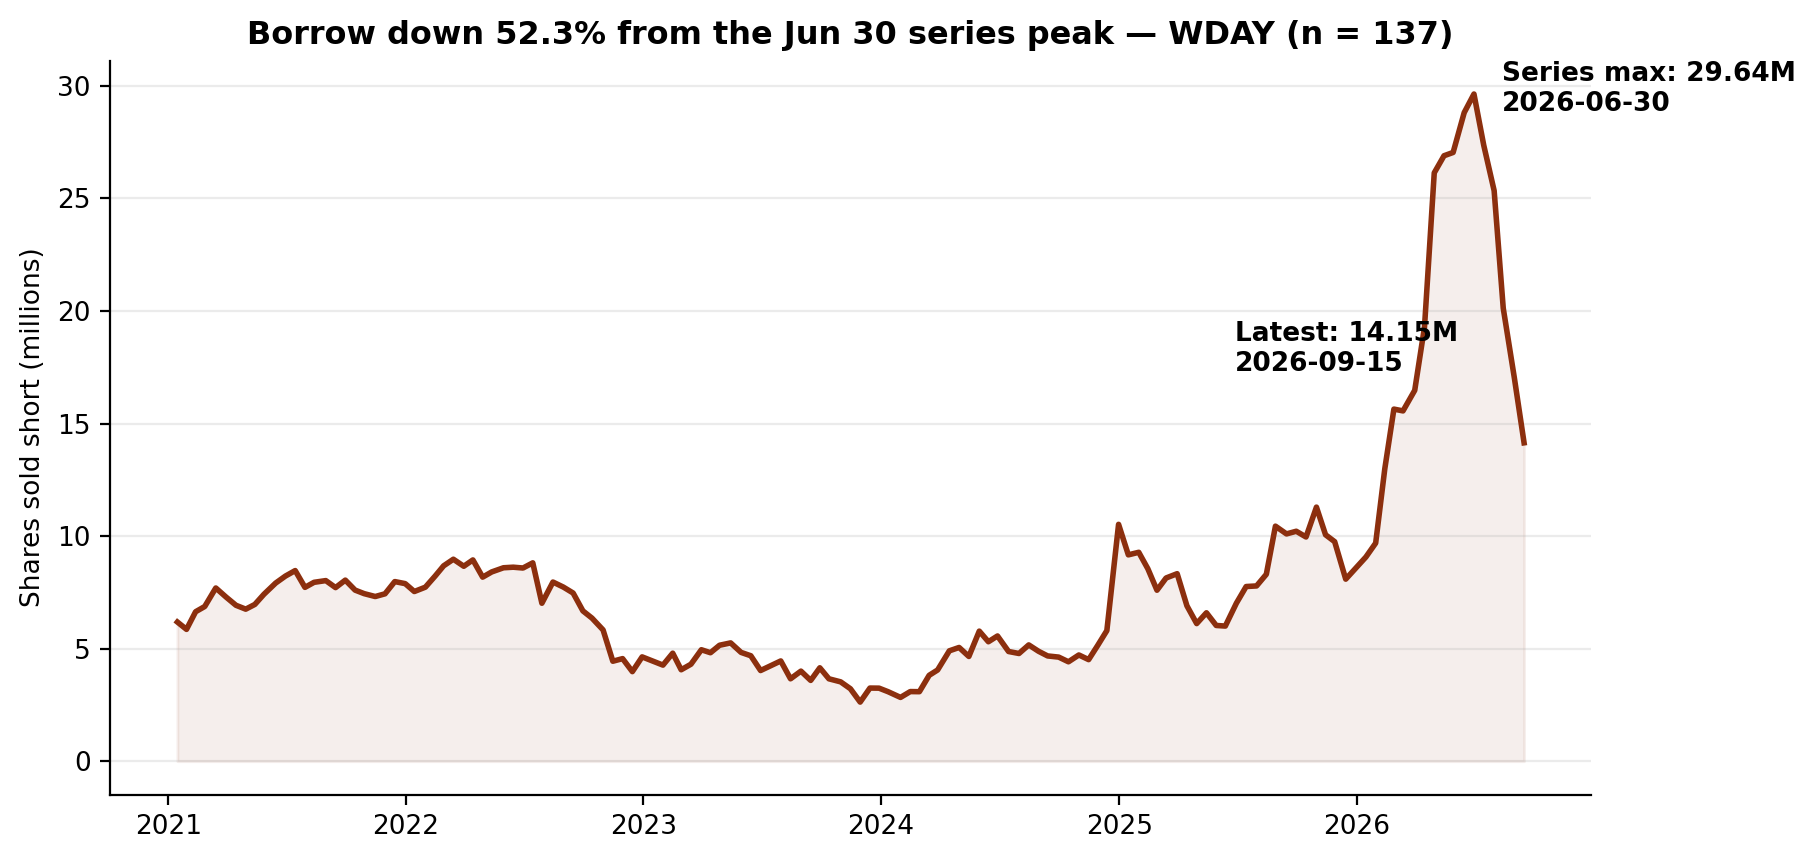
Lens 6 — short interest: 5.34% of the share count, halved since a June 30 peak, with no flagged step. The latest FINRA settlement, September 15, 2026, records 14,145,081 shares sold short — 5.34% of the 265,097,000 shares outstanding — at 5.42 days to cover, down 17.0% from the prior settlement (17,041,430 on August 31, 2026). The June 30, 2026 reading of 29,641,659 is the series maximum across all 137 settlements, so the latest sits 52.3% below that peak after five consecutive declines. The series contains no single-settlement step at or above 2 times: the largest step is a ratio of 1.813 on December 31, 2024, so there is no discontinuity to flag in this series.
The Gap
The narrative arriving this week is a momentum-and-attention story: a trending-stocks list led after a flagship conference and an Analyst Day, on a stock that rose 52.1% in the quarter after the 13F snapshot. The filings describe a register rebuilt before that run, not during it. The tracked cohort grew on every measure the register can show — the seven verified continuing holders added 10.0%, two new positions opened and both verify as new, one small holder exited, and the register rose 18.8% — while the broad market held 22.00% more shares with five fewer filers. Against that accumulation sit two absences: insiders have never bought a share in 172 filings, recording 446 sales instead, and the congressional lens holds a single House member. The 5% register's maximum is a founder's December 2024 print at 19.3%, and the borrow peaked on the snapshot date itself — 29,641,659 shares on June 30 — then fell for five straight settlements to 14,145,081. One plausible reading is that the tracked and broad-market accumulation is real but dated June 30, the price move came after it, and neither insiders nor the borrow are positioned the way a fresh-conviction story would suggest — accumulation in the register, silence from the insiders, and a borrow in retreat.
What Would Change the Picture
Nothing above is a recommendation. These filings would change it:
- 1. The 2026Q3 13F season (filing window closing mid-November 2026). All nine holders sit on a June 30 period-end, before the stock's 52.1% post-quarter rise. Whether the top two — Eagle Capital's 11,323,681 shares and First Eagle's 8,824,517, together 77.3% of the cohort — held through that rise, and whether the two new positions (Pzena's 1,971,270 shares, GQG's 15,242) are still there, decides whether this lens reads as accumulation or a pre-run snapshot.
- 2. A first insider purchase in the parsed record. The record holds no purchase transaction in 172 filings — no buyer in any window — against 446 sales. Any open-market purchase would be the first in the record.
- 3. A first Senate row, or a second congressional member. The combined record holds one House member (1 purchase, 3 sales, last purchase August 18, 2026) and the Senate archive holds no row; a first Senate transaction, or any second member, would widen a lens that currently rests on one member.
- 4. A fresh 5% print above the standing maximum. The register's newest filing is dated September 4, 2026 (BlackRock, Inc. as of August 31, 2026, at 10.0%), and its maximum — David A. Duffield at 19.3% — is as of December 31, 2024. A new filing moving the maximum, or a first 13D, would change this lens.
- 5. Short interest back through the June 30 peak. The borrow stands at 14,145,081 shares, down 17.0% on the settlement and 52.3% below the June 30, 2026 peak of 29,641,659. A reading back at or above 29,641,659 would reverse five settlements of decline and set a new series high.
Related reading: Nine of 147: One Holder Is 33.6% of the Superinvestors' General Motors Stake. Its Insiders Have Bought Once. — Filing Tape #110; Six of 147: Yacktman Is 49.7% of the Superinvestors' June-Quarter LHX Stake. Its Insiders Have Never Bought a Share. — Filing Tape #109. Workday's own page: Workday (WDAY) on GetCoattail.
Methodology and data notes
- As-of & limits: The lenses rest on different clocks, none live: 13F is a June 30, 2026 snapshot published up to 45 days later; Form 4 runs through October 2, 2026; Congress aggregates run through October 3, 2026 (Senate through October 1, 2026); 13D/G through September 4, 2026; short interest through September 15, 2026; the price file ends October 2, 2026. Five limits are specific to this audit. First, the roster expanded before the recent audits — from 85 managers (83 filing) to 149 (147 filing) — so "of 147" counts are not comparable to earlier pieces' "of 83" figures. Second, there is no period mix in this name's superinvestor lens: all nine holders sit at June 30, 2026, and the collection's three September 30 early filers hold no WDAY, so no split reporting is needed. Third, both positions labelled NEW in the collection were cross-checked against the pipeline first-quarter register under each manager's own filing-agent prefix, and neither prefix carries a first-quarter row for this name — so, unlike the previous audit, both labels verify and this audit reports them as new without qualification. Fourth, the site's insider aggregate for the 90-day window does not match the full Form 4 parse for this name (see the insider note), so this audit uses the full parse throughout and discloses the mismatch wherever the lens is described. Fifth, this week's article (October 16, 2026) postdates the 13F snapshot and the short-interest series; the article is known to this audit only from outside coverage, not from our own files, and none of its price figures — including its cited analyst target — are cited here; every price figure here is from our own price file.
- Superinvestor lens: 147 managers in the collection (of a 149-manager roster; 144 at a June 30, 2026 period-end and 3 early filers at September 30, 2026, none holding this name) collected directly from SEC EDGAR Form 13F (managers_13f collection, regenerated October 15, 2026 for the expanded roster); Workday positions are counted on the single CUSIP 98138H101, long rows only, and there are no option rows for this name in the collection. Nine distinct managers hold long positions, all at June 30, 2026, totalling 26,061,476 shares worth $3,190,445,966. The direction count is 5 INCREASED, 2 NEW and 2 DECREASED. Eagle Capital Management's share of the cohort is 43.4% = 11,323,681 / 26,061,476; First Eagle Investment Management's is 33.9% = 8,824,517 / 26,061,476; the top two together are 77.3% = 20,148,198 / 26,061,476; Richard Pzena - Pzena Investment Management's is 7.6% = 1,971,270 / 26,061,476 and GQG Partners' is 0.1% = 15,242 / 26,061,476. All seven continuing holders verify row by row against the first quarter under the rule used in the previous audits — a holder's first-quarter row accepted only when it sits under the same filing-agent prefix as the manager's second-quarter accession and its implied shares-change reproduces the EDGAR shares-change label at one decimal place — so the verified continuing total is 21,888,932 shares at March 31 moving to 24,074,964 at June 30 (+10.0%), with no unverified holder. Both NEW labels verify: neither Richard Pzena - Pzena Investment Management's nor GQG Partners' filing-agent prefix carries a first-quarter register row for this name, so both positions are new in the register as well as in the collection. There is one exit: Skye Global Management's first-quarter register row held 52,600 shares and its prefix does not appear in the second quarter. The pipeline register totals reconcile in both quarters (8 rows and 21,941,532 shares in the first quarter, equalling the verified continuing total plus the exited holder's row, 21,888,932 + 52,600; 9 rows and 26,061,476 shares in the second, equalling the cohort total — a register change of +18.8%). Implied per-share value: all nine rows imply exactly $122.42, the June 30, 2026 close; the cohort total implied price is $122.42, 0.0% against the close.
- Full-market lens: SEC Form 13F Data Sets full-market aggregation. The primary table is the full13f collection's by-ticker file (holders = distinct filers reporting the ticker's CUSIP; 908 reported long positions out of 922 filers). Workday carries one CUSIP in this aggregation (98138H101), and the backfill fixtures' by-CUSIP row matches the by-ticker row on every field — holders, long holders, shares, reported value, prior holders and prior reported value — exactly. The by-ticker file's entered/exited fields (815 and 820, a net of -5 that matches the change in holder count) are gross flows, so this audit headlines the net change. Reported-value caution: the aggregate value ($26,181,042,667 over 206,575,322 shares) implies $126.74 per share against a June 30, 2026 close of $122.42 in our price file, a gap of +3.53% — printed here as found. The aggregate sums the VALUE of every information-table row — including put and call option rows — while the share count covers long common-stock rows only, so we headline filer and share counts and label dollar values "reported."
- Insider lens: full-parse Form 4 aggregation (agg_by_ticker), record as of October 2, 2026 (172 filings). Sale and purchase counts are transaction-code counts (S and P) in non-derivative rows; grants and exercises are not counted as purchases, and one filing can contain many transaction rows. The 90-day window (July 5 to October 2, 2026) holds 0 purchase transactions and 79 sale transactions (905,594 shares, $161,617,526.52, 0 buyers, 5 sellers, 15 officer sale transactions) across 19 filings. The one-year window (October 3, 2025 to October 2, 2026) holds 0 purchase transactions and 281 sale transactions (3,484,335 shares, $555,432,330.56, 0 buyers, 8 sellers, 62 officer sale transactions) across 99 filings. The full record holds 0 purchase transactions (0 shares, $0, 0 buyers, 0 officer purchase transactions) and 446 sale transactions (4,786,608 shares for $869,485,879.97 by 11 sellers with 97 officer sale transactions). The site's insider aggregate (90-day window, as of October 17, 2026) carries a row for this name that does not match the full parse's 90-day window (site: 0 purchases, 45 sales, $130,270,711.81, 1 seller; full parse: 0 purchases, 79 sales, $161,617,526.52, 5 sellers; insider_site_match_w90=false), so this audit cites the full parse only; both records agree that purchases are zero in the window, and the full parse extends that to every window. Window price checks on our price file: the 90-day sales imply $178.47 per share, inside the 90-day close range ($127.87 to $206.92); the one-year sales imply $159.41, inside the one-year close range ($112.50 to $245.67); the full-record sales imply $181.65, inside the price file's full-period close range ($112.50 to $307.21) — so dollar totals are cited for every window.
- 13D/G lens: full-parse SC 13D/G parsed filings (14 filings matching issuer CIK 1327811 on CUSIP 98138H101: 4 SC 13G and 10 SC 13G/A, 10 of them amendments, no SC 13D), filings through September 4, 2026. The site aggregation carries this name under a ticker-keyed row; that row (14 filings, 0 D-filings, 14 G-filings, 10 amendments, 7 reporters, latest date September 4, 2026, maximum 19.3%, total reported 286,587,340 shares) matches the parsed filings on filings, form mix, amendments, latest date, maximum and the cross-date reported total. The total sums reporter rows across filings and dates (14 reporter rows), so it is a filing-volume total, not a stake. The rows are reported as filed, under the names exactly as they appear: David A. Duffield printing 51,191,345 shares at 19.3% as of December 31, 2024, filed February 12, 2025 as SC 13G/A (the register maximum); BlackRock, Inc. printing 19,666,221 shares at 10.0% as of August 31, 2026, filed September 4, 2026 as SC 13G/A (the latest filing); The Vanguard Group printing 20,142,800 shares at 9.41% as of December 31, 2024, filed January 31, 2025; BlackRock, Inc. printing 17,540,102 shares at 8.2% as of December 31, 2024, filed February 5, 2025; The Vanguard Group printing 21,799,056 shares at 10.04% as of September 30, 2025, filed October 6, 2025; David A. Duffield printing 49,350,689 shares at 19.01% as of December 31, 2025, filed February 12, 2026; The Vanguard Group printing 25,009,288 shares at 11.74% as of December 31, 2025, filed January 30, 2026; The Vanguard Group printing 0 shares at 0.0% as of March 13, 2026, filed March 27, 2026; Hotchkis and Wiley Capital Management, LLC printing 10,655,733 shares at 5.07% as of March 31, 2026, filed May 15, 2026; Vanguard Portfolio Management printing 11,704,297 shares at 5.57% as of March 31, 2026, filed April 29, 2026; Vanguard Capital Management printing 15,944,978 shares at 7.59% as of March 31, 2026, filed April 29, 2026; Eagle Capital Management, LLC printing 11,323,681 shares at 5.63% as of June 30, 2026, filed August 14, 2026; Hotchkis and Wiley Capital Management, LLC printing 12,679,129 shares at 6.31% as of June 30, 2026, filed August 12, 2026; and BlackRock, Inc. printing 19,580,021 shares at 9.7% as of June 30, 2026, filed July 30, 2026. The parsed coverage for this issuer holds these 14 filings; a 5% holder that has not filed in the covered window would not appear here.
- Congress lens: Senate PTR archive and House PTR archive as maintained on this site. The combined record (as of October 3, 2026) carries a row for this name (1 member, 1 purchase transaction, 3 sale transactions, last purchase August 18, 2026, party D); the House aggregate (as of October 3, 2026) carries the same row; the Senate aggregate (as of October 1, 2026) carries no row. A missing row and a row of zeros are different statements about the underlying archives, and this audit records the split as it stands: every recorded transaction for this name sits in the House archive as we hold them.
- Short interest lens: FINRA Equity Short Interest files (biweekly settlement dates), collected directly from FINRA's public distribution. The published series covers all 137 settlements under the symbol from January 15, 2021 (6,183,055 shares) to September 15, 2026. Every settlement row under the symbol is this issuer's row, under the single issuer name in the files — "Workday, Inc. Class A Common S" on all 137 settlements; there are no other-issuer rows under the symbol. The latest reading is 14,145,081 shares on September 15, 2026, down 17.0% from the prior settlement (17,041,430 on August 31, 2026) and down 52.3% from the June 30, 2026 reading of 29,641,659, at 5.42 days to cover. Series discontinuity check — none found: the largest single-settlement step in the series is a ratio of 1.813, on December 31, 2024, when the print rose from 5,802,982 (December 13, 2024) to 10,523,376; no step reaches 2 times, so there is no flagged step to disclose in this series. The June 30, 2026 reading is the series maximum; the series minimum is 2,626,167 shares on November 30, 2023. The recent path runs 29,641,659 (June 30), 27,369,617 (July 15), 25,349,192 (July 31), 20,124,869 (August 14), 17,041,430 (August 31) and 14,145,081 (September 15) — five consecutive declines. FINRA publishes each settlement about two weeks after the fact, so the October price action is not yet in this series. The share-count ratio (5.34%) uses the fundamentals file's shares-outstanding figure below.
- Fundamentals note: our fundamentals collection carries Workday's revenue of $9,552,000,000, net income of $693,000,000 and assets of $18,074,000,000 — all three labelled fiscal 2026 in the file and all sourced to the same financial-series cache, so there is no vintage split to flag. The file is marked ok for this name, with no missing fields: shares outstanding of 265,097,000 (sourced in the file to the shares-outstanding count as of January 31, 2026) and a file-computed market value of $49,453,846,159.01. The file does not flag the issuer as a foreign private issuer, and it carries SIC 7374, Services-Computer Processing & Data Preparation, and a Nasdaq listing. The file's price for the name is $186.55 as of October 6, 2026; our daily-close file ends October 2, 2026 at $186.14, and we keep the two files' figures separate rather than blending them.
- Prices: our own daily-close file for WDAY through October 2, 2026 ($186.14 close, -13.3% year to date on that file; the 252-session closing high is $245.67 on October 21, 2025, so the last close sits 24.2% below it; the 252-session closing low is $112.50 on April 10, 2026, so the last close sits 65.5% above it; closes of $129.92 at March 31, 2026 and $122.42 at June 30, 2026, a second-quarter change of -5.8%; change from June 30 to October 2 of +52.1%; change from the September 30, 2025 close of $240.73 of -22.7%; change from the October 2, 2025 close of $232.10 of -19.8%; the December 31, 2025 close is $214.78). The series in our price file begins June 1, 2021 at $226.41 and holds 1,342 rows; the file's full-period close range is $112.50 to $307.21.
- Market context sources: the TipRanks article "3 Trending Stocks Analysts Are Watching and Why, October 16," published October 16, 2026, in which Workday appeared first, ahead of Domino's Pizza and JPMorgan Chase, with 14 analyst ratings in 72 hours after Workday Rising 2026 and its Analyst Day and fiscal 2028 targets maintained; the AltIndex StockTwits most-mentioned list refreshed on October 17, 2026, whose top names were already covered, skipped, crypto or index funds in this series; and the Google Trends United States daily list (CyberKendra snapshot updated October 17, 2026), whose top ten were led by sports queries with no single-stock query. Figures we could not confirm were left out; the external items above are reported speech from those outlets, not GetCoattail measurements, and none of their price figures — including the analyst target the TipRanks article cites — are cited in this audit.
- Workday is in the GetCoattail stock-page universe: Workday (WDAY) stock page. Series data: wday_lens_data.csv · wday_short_interest_series.csv. Earlier audits: General Motors · L3Harris.
Past patterns are not a promise of future results. For education only — not investment advice.
This article describes public filings as of the dates stated. It is not investment advice and makes no recommendation. Filings lag reality: 13F positions are as of June 30, 2026, and later trading is not yet public.
Revision history
- v1.0 — October 18, 2026: first publication.