- 11,129 disclosed sells in the window (191 members); 7,927 scored at 63 days.
- Pooled 63-day excess vs SPY: +0.03%, clustered 95% CI [−0.76, +0.74] — includes zero.
- Senate +0.37% (n = 1,088) vs House −0.02% (n = 6,839) — indistinguishable.
- Holdout failed: derivation −0.48% reversed to validation +0.55%; both intervals include zero.
After the sale became public, the stocks members sold matched the market over the next 63 trading days — and the first half's negative average reversed in the second half.
Why this question matters
A disclosed sale is easy to misread. The natural story is that the seller knows something, so the stock should fall next. The testable version is narrower: after the disclosure becomes public, does the sold stock lag the market by enough, and consistently enough, to call it timing?
That distinction matters because of what a reader can actually do. A trade happens first and is disclosed later, so the only moment a reader could act is after the filing appears. This study therefore anchors everything to the disclosure date, not the transaction date. It asks whether the stocks members sold, measured from the first trading day after disclosure, went on to lag SPY. If the answer were yes, a disclosed sale would be a usable warning sign. The answer here is no — stated plainly rather than dressed up.
How we tested it
The sample covers every disclosed sale we could score from October 1, 2021 through September 30, 2026. Senate records come from Senate financial disclosure reports (16,719 rows, 2,295 documents). House records come from the House Clerk index plus parsed periodic transaction reports (21,907 rows). The House backfill file contributes nothing inside the window (latest filing December 30, 2020), and the House figures here do not use the newer House PTR staging batches, a separate collection that is not mixed in.
From 15,500 extracted sales with a ticker (exchange transactions excluded), 11,129 fall inside the window and belong to 191 members — the analysis population. Scoring requires a price series, a first trading day after disclosure, and a full 63 trading days for both the stock and SPY, leaving 7,927 scored sales from 169 members; the other 28.8% are missing for reasons the limits section breaks down.
The rule is strict about what a reader could have known. Entry is the close of the first trading day after the disclosure date, never the transaction date, so no look-ahead is baked in. Exit is 63 trading days later, each security on its own trading calendar. Excess return is the stock's total return minus SPY's over the same window, in percentage points. For a sale the sign flips versus a buy: a negative excess means the stock lagged SPY — good timing for the seller — and the "loss avoided" is simply its negative. Uncertainty uses member-clustered intervals: trades cluster inside members (the two most active alone account for 18.4% of scored sales), and a plain interval would overstate precision.
Headline result: the average sold stock matched the market
Over 63 trading days, the pooled average excess return is +0.03%, with a median of −1.52% and 54.6% of sold stocks lagging SPY. The member-clustered 95% confidence interval runs from −0.76 to +0.74 percentage points and includes zero, so there is no evidence of a timing edge in either direction. The Senate (+0.37%, n = 1,088) and the House (−0.02%, n = 6,839) are indistinguishable: the chamber difference is +0.39 percentage points (clustered interval −1.12 to +2.28), which also includes zero.
The shorter horizons tell the same story: at 21 days the pooled average is −0.03% (clustered interval −0.37 to +0.28, n = 8,351); at 42 days it is +0.12% (clustered interval −0.36 to +0.56, n = 8,190). All nine headline cells — three scopes times three horizons — have clustered intervals that include zero.
Table 1. Disclosed sells, excess return vs SPY (stock minus SPY, percentage points). "Lagging SPY" means excess below zero — good timing for the seller.
| Scope | Horizon | n | Members | Mean | Median | Lagging SPY | Clustered 95% CI |
|---|---|---|---|---|---|---|---|
| Pooled | 21 days | 8,351 | 173 | −0.03% | −0.51% | 53.0% | [−0.37, +0.28] |
| Pooled | 42 days | 8,190 | 173 | +0.12% | −0.75% | 53.1% | [−0.36, +0.56] |
| Pooled | 63 days | 7,927 | 169 | +0.03% | −1.52% | 54.6% | [−0.76, +0.74] |
| Senate | 63 days | 1,088 | 30 | +0.37% | −0.91% | 54.6% | [−0.89, +2.05] |
| House | 63 days | 6,839 | 141 | −0.02% | −1.63% | 54.6% | [−0.92, +0.77] |
One number needs a warning label. The median sold stock lagged SPY by 1.52%, which can look like timing skill until the buy side is checked: the median disclosed buy also lagged SPY, by 1.41%. The typical single stock trails the index, so a negative median alone is not evidence of timing. The mean, which is what an edge claim must rest on, is essentially zero.
Does it hold up? Robustness checks
A null result is only useful if it survives reasonable changes to the setup. None of these produced an edge.
Full exits and partial trims look alike: full sells averaged −0.07% (n = 5,081, clustered interval −0.93 to +0.69), partial sells +0.22% (n = 2,846, clustered interval −0.95 to +1.24). Exiting entirely shows no better timing than trimming. Weighting each member equally gives −0.54% (95% t interval on the 169 member means, −1.94 to +0.86); weighting by disclosed-range midpoints — estimates, not exact dollars — gives +0.59% (clustered interval −0.70 to +2.14). Using only the primary price source gives −0.02% (n = 7,404, clustered interval −0.78 to +0.65); entering on the disclosure day itself gives −0.03% (clustered interval −0.78 to +0.65). Restricting Senate sells to stock assets only gives +0.73% (n = 954, clustered interval −0.81 to +2.29). Removing the two most active members — Josh Gottheimer (917) and Lisa C. McClain (545), together 18.4% of the sample — gives −0.30% (n = 6,465, clustered interval −1.06 to +0.48). Concentration does not manufacture the conclusion.
The buy side, run through the same pipeline as a control, is the mirror image: disclosed buys at 63 days averaged +0.01% (median −1.41%, 45.7% beating SPY, clustered interval −0.67 to +0.66, n = 7,270). The sell-minus-buy difference is +0.02 percentage points (clustered interval −0.76 to +0.81): sells and buys are indistinguishable after disclosure. One buy-side cell does exclude zero — Senate buys at 63 days averaged +1.14% (clustered interval +0.11 to +3.43, n = 849) — but that is a buy signal, not the sell signal tested here; the sell-minus-buy gap still includes zero. As a pipeline sanity check, the same code recomputes the previously published Senate-versus-House buy comparison at 60 days and essentially reproduces it on the primary price source alone (Senate n = 815, +1.46%, versus published n = 817, +1.46%). The sell null is not a coding artifact.
The holdout test: the pattern did not survive
The strongest check splits the sample by disclosure date at September 25, 2024, the median filing date of scored sells. The first half (derivation) averaged −0.48% (n = 3,963, clustered interval −1.45 to +0.44); the second half (validation) averaged +0.55% (n = 3,964, clustered interval −0.45 to +1.43). The sign flipped, and both intervals include zero. The verdict is plain: the sell-timing claim did not survive the holdout. By chamber, validation means were +1.52% for the Senate (n = 326, clustered interval −2.33 to +4.41) and +0.46% for the House (n = 3,638, clustered interval −0.65 to +1.38) — again, both include zero. A reader trusting the first half's negative average would have been on the wrong side of the second.
Table 2. Holdout split by disclosure date (boundary September 25, 2024), 63-day excess vs SPY.
| Scope | Segment | n | Mean | Clustered 95% CI |
|---|---|---|---|---|
| Pooled | Derivation (before boundary) | 3,963 | −0.48% | [−1.45, +0.44] |
| Pooled | Validation (from boundary) | 3,964 | +0.55% | [−0.45, +1.43] |
| Senate | Validation | 326 | +1.52% | [−2.33, +4.41] |
| House | Validation | 3,638 | +0.46% | [−0.65, +1.38] |
Cases: the best, the worst, and the typical
Averages hide an enormous spread: 3,599 scored sells (45.4%) beat SPY by an average of +13.54 points, while 4,328 (54.6%) lagged by an average of −11.20 points. The full distribution runs from −74.3% to +188.8%.
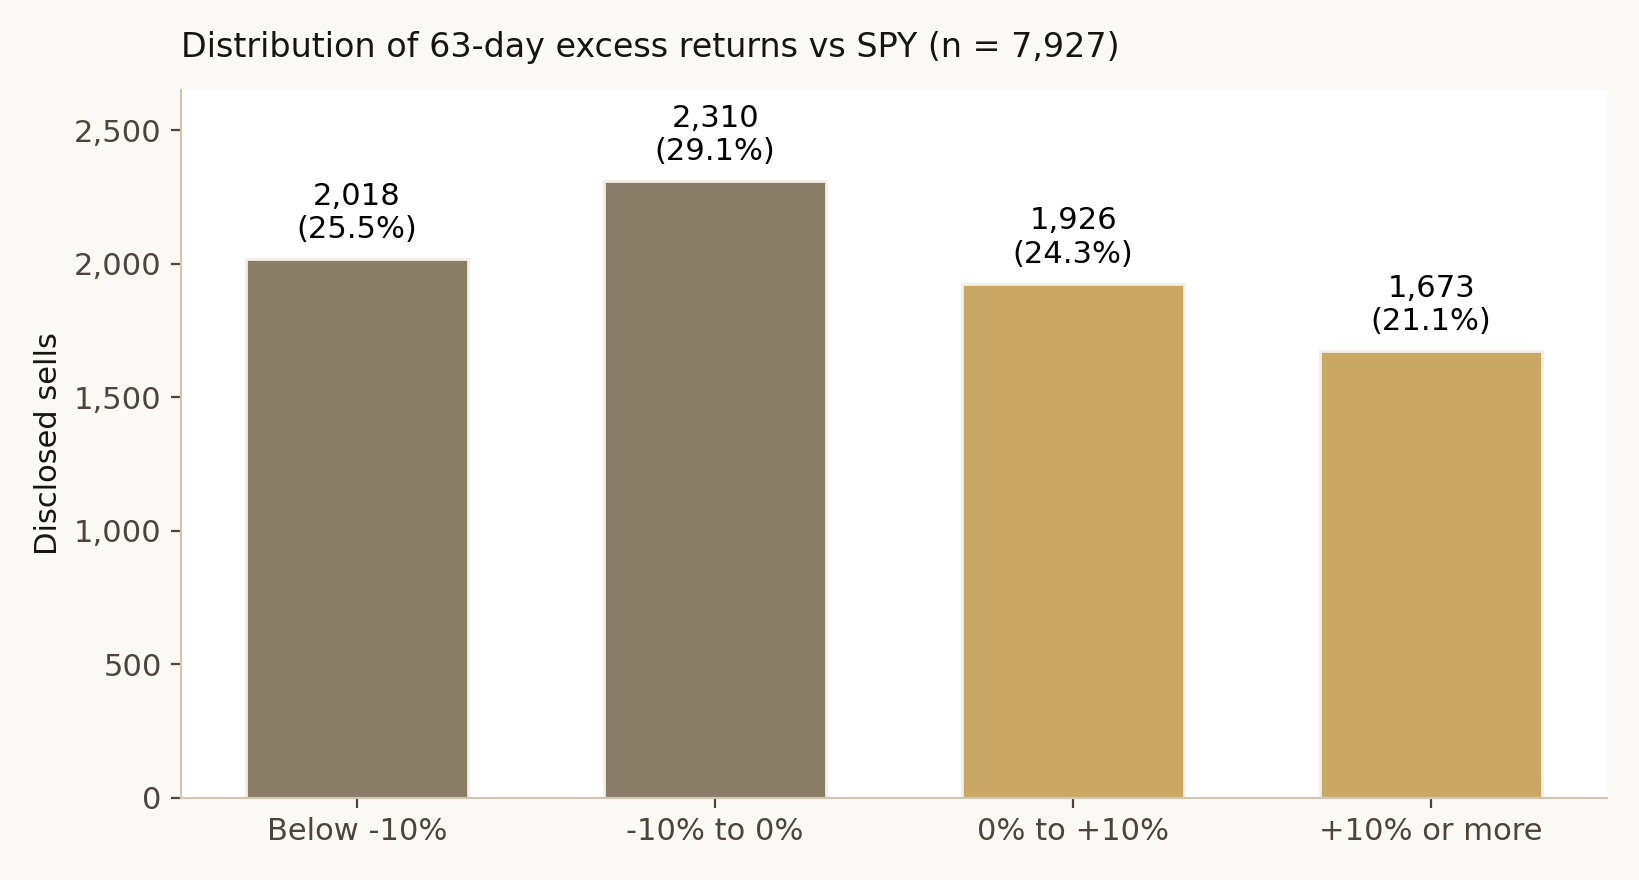
The best-timed sale is also the single lowest excess return: Representative Gilbert Ray Cisneros, Jr. sold Centene (CNC) in full — traded March 31, 2025, disclosed April 7, entered April 8, exited July 10 — for an excess of −74.3%, a loss avoided of +74.3 points against SPY, on a disclosed range of $1,001 to $15,000. The worst-timed sale is the single highest: Senator Markwayne Mullin sold Dell (DELL) in full — traded February 4, 2026, disclosed March 2, entered March 3, exited June 2 — for an excess of +188.8%, the stock surging after the sale, on a disclosed range of $15,001 to $50,000. The typical sale sits near the middle: Representative John R. Curtis sold Alphabet (GOOG) in full — traded December 4, 2023, disclosed December 15, entered December 18, exited March 20, 2024 — for an excess of −1.52%, exactly the pooled median, on a disclosed range of $15,001 to $50,000. Cases this extreme are why the study leans on clustered intervals, not anecdotes.
Table 3. Distribution of 63-day excess returns, scored sells (n = 7,927).
| Excess vs SPY | Sells | Share |
|---|---|---|
| Below −10% | 2,018 | 25.5% |
| −10% to 0% | 2,310 | 29.1% |
| 0% to +10% | 1,926 | 24.3% |
| +10% or more | 1,673 | 21.1% |
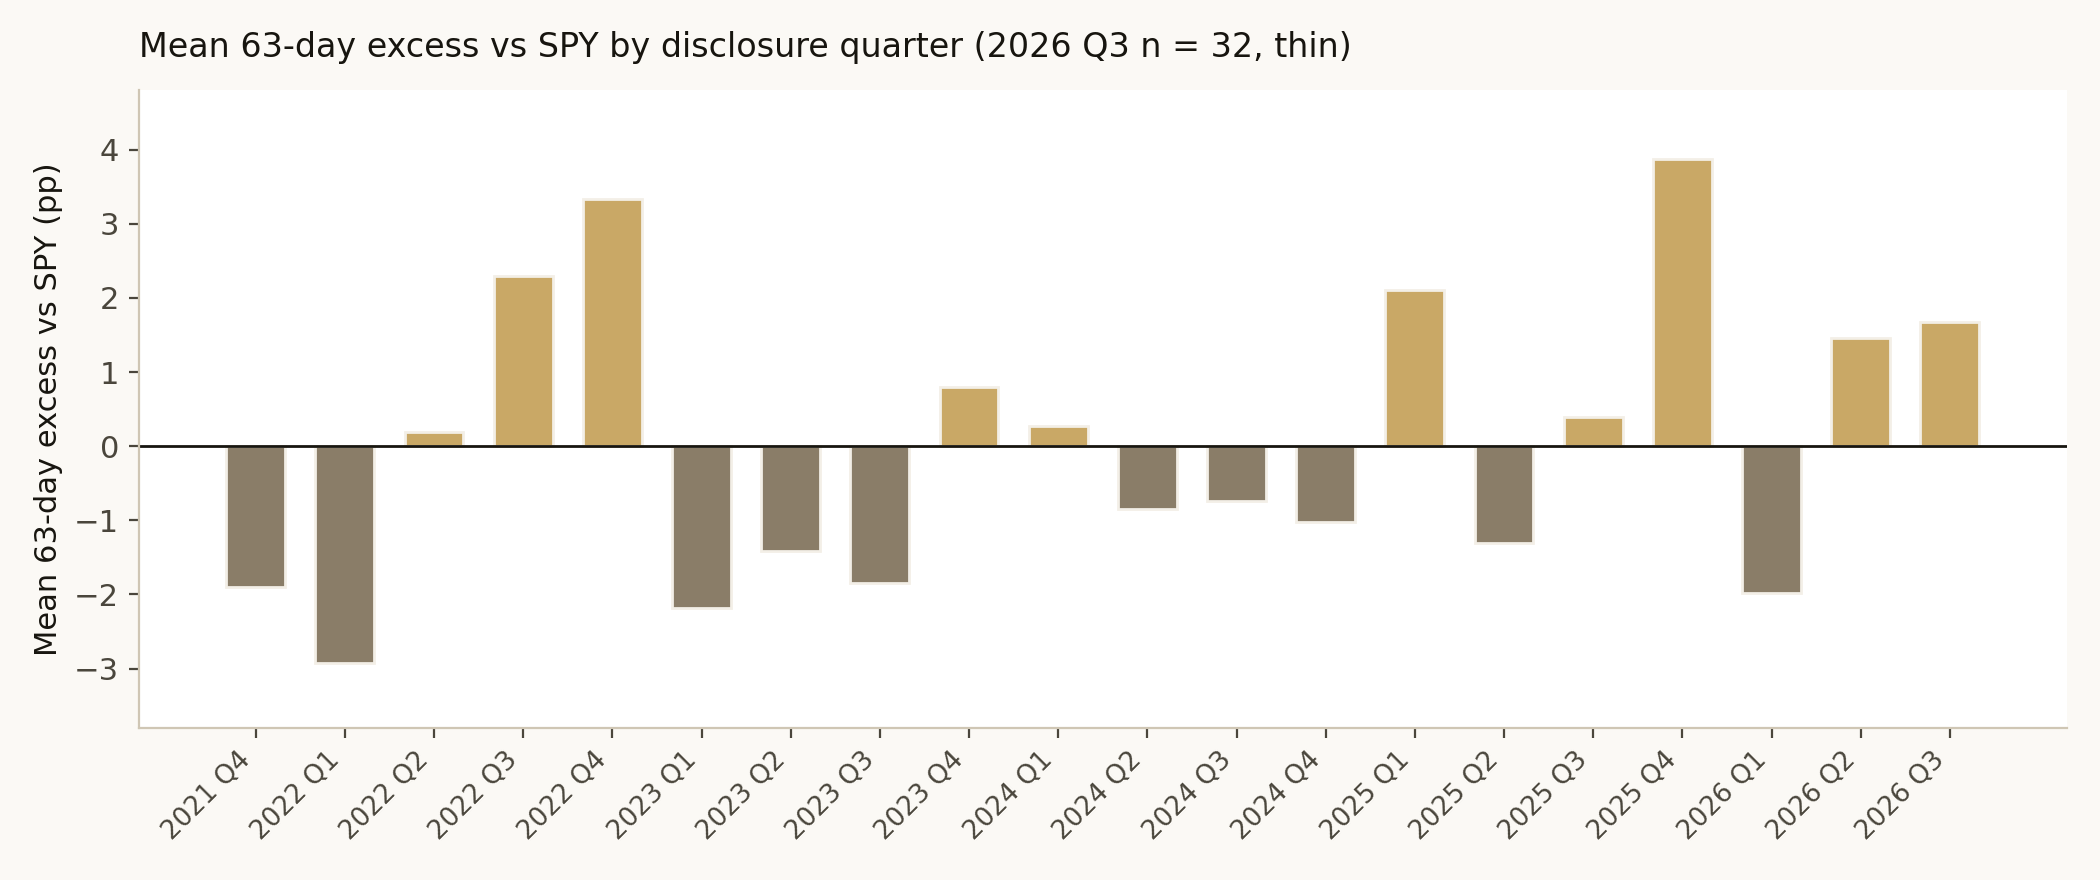
Table 4. Scored sells by disclosure quarter: mean 63-day excess vs SPY. Quarters are filing quarters, not transaction quarters.
| Quarter | n | Mean | Median | Share lagging SPY |
|---|---|---|---|---|
| 2021 Q4 | 243 | −1.90% | −2.75% | 57.6% |
| 2022 Q1 | 324 | −2.93% | −2.38% | 56.8% |
| 2022 Q2 | 278 | +0.19% | +0.61% | 47.8% |
| 2022 Q3 | 261 | +2.30% | +2.48% | 42.5% |
| 2022 Q4 | 314 | +3.34% | −0.23% | 51.0% |
| 2023 Q1 | 334 | −2.18% | −4.47% | 65.3% |
| 2023 Q2 | 513 | −1.42% | −3.16% | 57.5% |
| 2023 Q3 | 387 | −1.85% | −2.41% | 58.9% |
| 2023 Q4 | 455 | +0.80% | −0.08% | 50.5% |
| 2024 Q1 | 260 | +0.27% | −0.68% | 54.6% |
| 2024 Q2 | 174 | −0.85% | −0.87% | 53.4% |
| 2024 Q3 | 421 | −0.74% | −1.60% | 54.2% |
| 2024 Q4 | 149 | −1.02% | −2.76% | 58.4% |
| 2025 Q1 | 448 | +2.10% | +0.61% | 46.9% |
| 2025 Q2 | 1,046 | −1.30% | −4.04% | 61.1% |
| 2025 Q3 | 670 | +0.39% | −2.91% | 57.9% |
| 2025 Q4 | 759 | +3.87% | +1.65% | 47.2% |
| 2026 Q1 | 512 | −1.98% | −3.57% | 60.0% |
| 2026 Q2 | 347 | +1.46% | +0.51% | 47.0% |
| 2026 Q3 | 32 | +1.68% | +1.16% | 43.8% |
Ten of the twenty quarters average negative and ten average positive. The final quarter is thin (n = 32) because 63-day windows for filings near the September 30 window end run past the end of the price data. No quarter, on its own, rescues an edge claim.
Objections and limits
The most serious objection is the missing data. Of the 11,129 sales in the population, 3,202 (28.8%) could not be scored at 63 days: 1,814 had no price series in any source, 792 had no trading day after disclosure, 550 lacked a full 63 trading days for the stock, and 46 lacked them for SPY. Attrition is higher for the Senate (36.0%) than the House (27.5%), so chamber comparisons carry different dropout biases under the same price-universe rules. One bias direction deserves stating: the price universe centers on currently listed tickers, so delisted stocks — often the worst performers — are more likely to be missing. For sells, missing a stock that went on to fall removes a well-timed sale and biases measured excess upward, making timing look worse, not better. That bias works against finding an edge, so it does not manufacture a favorable null — but the true average could sit below +0.03%, which is one more reason this article claims only "no evidence of an edge," not proof that no edge exists.
Three more limits apply. First, the fallback price source: 405 scored sales (5.1%) use dividend-unadjusted closes, which can bias their excess upward by the dividend yield; the primary-source-only check leaves the conclusion unchanged. Second, the Senate headline has no asset-type filter, so it includes non-stock rows such as stock options, while the House parsing has no asset-type field at all — the Senate stock-only subset above is the closest check. Third, coverage: the 191 members in the population are only those who appear in these sources with trades, not all 535 members of Congress, and chamber assignment follows the document's source, not a member's current chamber — two members are counted in both chambers because they moved during the window.
How to read the next disclosed sale
Three habits follow from this result, and none is a trade instruction. First, when a sale makes news, check the member's buy record next to the sell record before concluding anything about foresight: in this sample the two sides look alike. Second, read the sign correctly — for a sale, a negative excess after disclosure means the stock lagged the market, good timing for the seller, while a positive excess means the seller sold too early. Third, anchor on the disclosure date, not the transaction date: the only return a reader could have captured starts the trading day after the filing appears. A sale, on its own, is not a forecast. It becomes interesting only when the disclosure record, the price record, and a test like this one agree — here, they do not.
Methodology and data
Sources: Senate financial disclosure reports (2,295 documents, 16,719 rows) and House Clerk index plus parsed periodic transaction reports (21,907 rows). The House backfill file (5,244 documents, 25,138 rows) contributes zero in-window documents. Official portals: U.S. Senate Financial Disclosures (eFD) and U.S. House Clerk financial disclosures. Window: disclosures filed October 1, 2021 through September 30, 2026. Signal: a disclosed sale with a ticker, exchange transactions excluded; duplicate re-filings under name variants removed keeping the first filing; 12 rows with unresolvable member identifiers excluded. Entry: close of the first trading day after the disclosure date. Exit: 63 trading days later (21 and 42 days also scored), each security on its own trading calendar. Benchmark: SPY total return over the same window. Price sources, in priority order per trade: adjusted closes, then a second adjusted-close source, then unadjusted closes as fallback only; SPY from a single dividend-adjusted series. Intervals: member-clustered bootstrap (4,000 replications) alongside conventional intervals; the clustered interval is the headline because trades concentrate within members. Composition of the population: Senate full 1,048 and partial 653; House full 6,273 and partial 3,155. House full/partial follows the filing's own partial-sale marker; the Senate headline has no asset-type filter.
Past patterns are not a promise of future results. For education only — not investment advice. Trading costs and taxes are not reflected.