GetCoattail Research — The Filing Tape #76. Morgan Stanley is the only listed-company name on today's United States search list, and the filings describe a five-name tracked cohort rebuilt by one new position, a full market that added 272 filers, an insider record with no open-market purchase at all, and a strategic holder reporting 24.12%.
The Hype
Morgan Stanley is the stock name on today's search list: on Google Trends' United States list, "morgan stanley" drew 100+ searches and was the only entry naming a listed company, with a CNBC earnings headline attached. The reason is the calendar. The bank reported third-quarter results before the open on October 14: GAAP earnings per share of $3.03 against a FactSet consensus of $2.93, revenue of $20.34 billion, up 12% year over year against a $19.93 billion consensus, and net income of $4.97 billion, up 7%. CNBC reported that equities trading revenue exceeded expectations by $909 million. The price had already round-tripped part of the year: on our daily-close file it rose from $164.57 at March 31, 2026 to $209.04 at June 30 — up 27.0% — reached $228.55 on July 15, and last closed at $190.31 on October 2, down 16.7% from that high. The filings answer who held the stock through the rise, and what has been filed since.
The Tape
For Morgan Stanley — the seventy-sixth Filing Tape audit — the tape shows a five-name tracked cohort whose share count more than tripled on one new position in a quarter when the price rose 27.0%, a full market adding 272 filers and 134.8 million shares, an insider record with zero open-market purchases across its whole parsed history, one recorded congressional purchase, a 5% register dominated by a single strategic holder at 24.12%, and a borrow below 1% of the share count.
| Lens | As of | What the filings show | Direction vs prior period |
|---|---|---|---|
| Superinvestors (13F) | Jun 30, 2026 | 5 long holders; 2,288,540 shares; $478,396,330 | Holders 3 → 5 rows; shares +207.08% on one new position |
| All institutions (13F) | Jun 30, 2026 | 2,740 filers; 1,340,316,406 shares | Filers +272; shares +11.18% |
| Insiders (Form 4) | Oct 2, 2026 | 0 purchases in the full parsed record; last 90 days: 5 sales | Purchases have never appeared in any window |
| Congress | Oct 3, 2026 | 1 member, 1 purchase, 0 sales (House) | The single recorded trade is a purchase dated Jul 10, 2026 |
| 13D/G | Jul 15, 2026 | 5 parsed filings (3 SC 13D-family, 2 SC 13G-family); register maximum 24.12% (MUFG) | Latest filing is the strategic holder's third amendment |
| Short interest (FINRA) | Sep 15, 2026 | 14,693,087 shares; 0.94% of shares outstanding | Down 9.4% year over year; 50.7% below the series maximum |
Lens 1 — the superinvestors: five holders, and one new position is the story. We track 83 large, mostly long-only managers whose 13F portfolios we collect directly from SEC EDGAR. As of June 30, 2026, 5 held Morgan Stanley long, totalling 2,288,540 shares worth $478,396,330, with no option rows. Viking Global Investors holds 1,622,593 shares worth $339,186,841 — 70.9% of the cohort's position — at a 0.97% weight, labelled new. The other four are small: Pzena Investment Management (454,492 shares, decreased 4.6%), Matrix Asset Advisors (208,042 shares, decreased 12.6%), Torray Funds (2,377 shares, decreased 92.3%) and Mairs & Power Funds (1,036 shares, also new). Three of the five decreased, two are new, and no tracked manager exited. On the pipeline's holdings files, the cohort held 745,257 shares in 3 rows at March 31 and 2,288,540 at June 30 — up 1,543,283 shares (+207.08%), an increase smaller than Viking's new position alone, because the continuing holders trimmed. The implied price, $209.04, sits exactly on the June 30 close. 13F figures are as of June 30, 2026; funds have up to 45 days to file, so this picture is complete — and always lagging.
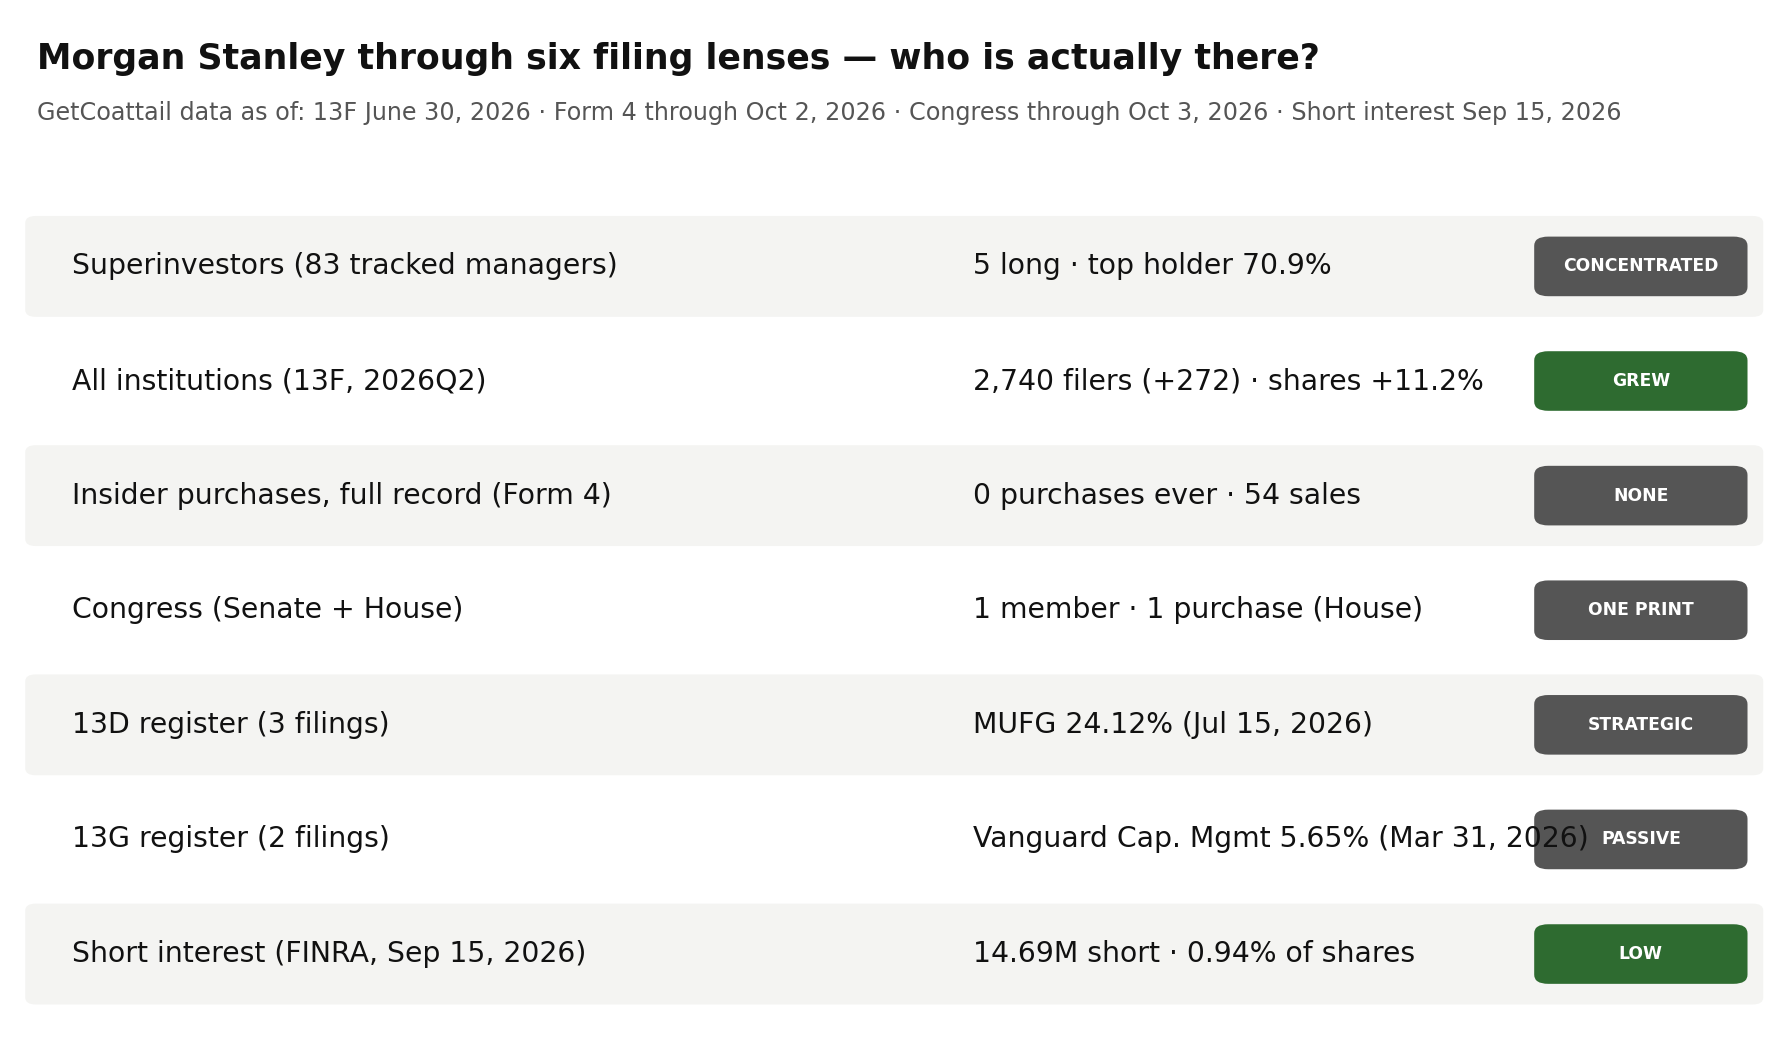
Lens 2 — institutions: 272 more filers, 134.8 million more shares. At June 30, 2026, 2,740 institutions reported positions, up 272 from 2,468 at March 31 (+11.02%), 2,727 of them long. Reported shares rose 11.18%, from 1,205,553,349 to 1,340,316,406 shares. Reported value rose 41.10% to $277,082,025,837; the aggregate includes option rows, so we headline filer and share counts and label dollars "reported" (see methodology). The broadening here is the full market's, not the tracked cohort's — the cohort's entire position is 2,288,540 shares.
Lens 3 — insiders: no open-market purchase, in any window, ever. The parsed Form 4 record holds 111 filings through October 2, 2026, and zero purchase transactions — in the last 90 days, in the last year, and across the full record. Buyers total zero in every window, and officer purchases total zero. What the record holds instead is sales: 5 sale transactions in the last 90 days totalling 40,719 shares and $8,881,800.42, by 3 sellers, four of them officer sales; 34 sales in the last year totalling 371,375 shares and $68,175,340.02, by 9 sellers; and 54 sales across the full record totalling 724,156 shares and $115,770,058.78, by 11 sellers, 52 of them officer sales. The site's own insider aggregate, compiled over the same 90-day window, matches the full parse exactly. We assign no motives; the record simply contains no purchase to describe.
Lens 4 — Congress: one member, one purchase. The combined record (as of October 3, 2026) carries one member with one purchase transaction and no sales, the most recent purchase dated July 10, 2026, filed under the House aggregate; the member's party is recorded as R. The Senate aggregate (as of October 1, 2026) carries no entry for this ticker. One transaction is a print, not a pattern, and this audit reports it as exactly that.
Lens 5 — the 5% register: five filings, and the maximum is a strategic holder. Our full parse holds exactly 5 SC 13D/G filings — three SC 13D/A amendments and two SC 13G-family filings, with four amendments in total — 5 reporting-person rows across 3 names, most recently filed July 15, 2026, matching the site aggregate's ticker-keyed row on every headline field. The register's maximum is Mitsubishi UFJ Financial Group, Inc. reporting 380,511,118 shares (24.12%) as of July 15, 2026 — its third amendment in the parse, after 380,010,887 shares (23.91%) as of November 3, 2025 and 380,307,520 shares (23.95%) as of April 13, 2026, the reported share count rising slightly each time. The Vanguard rows change reporting entity as filed: The Vanguard Group reports 0 shares (0.0%) as of March 13, 2026, and Vanguard Capital Management then reports 89,855,360 shares (5.65%) as of March 31, 2026.
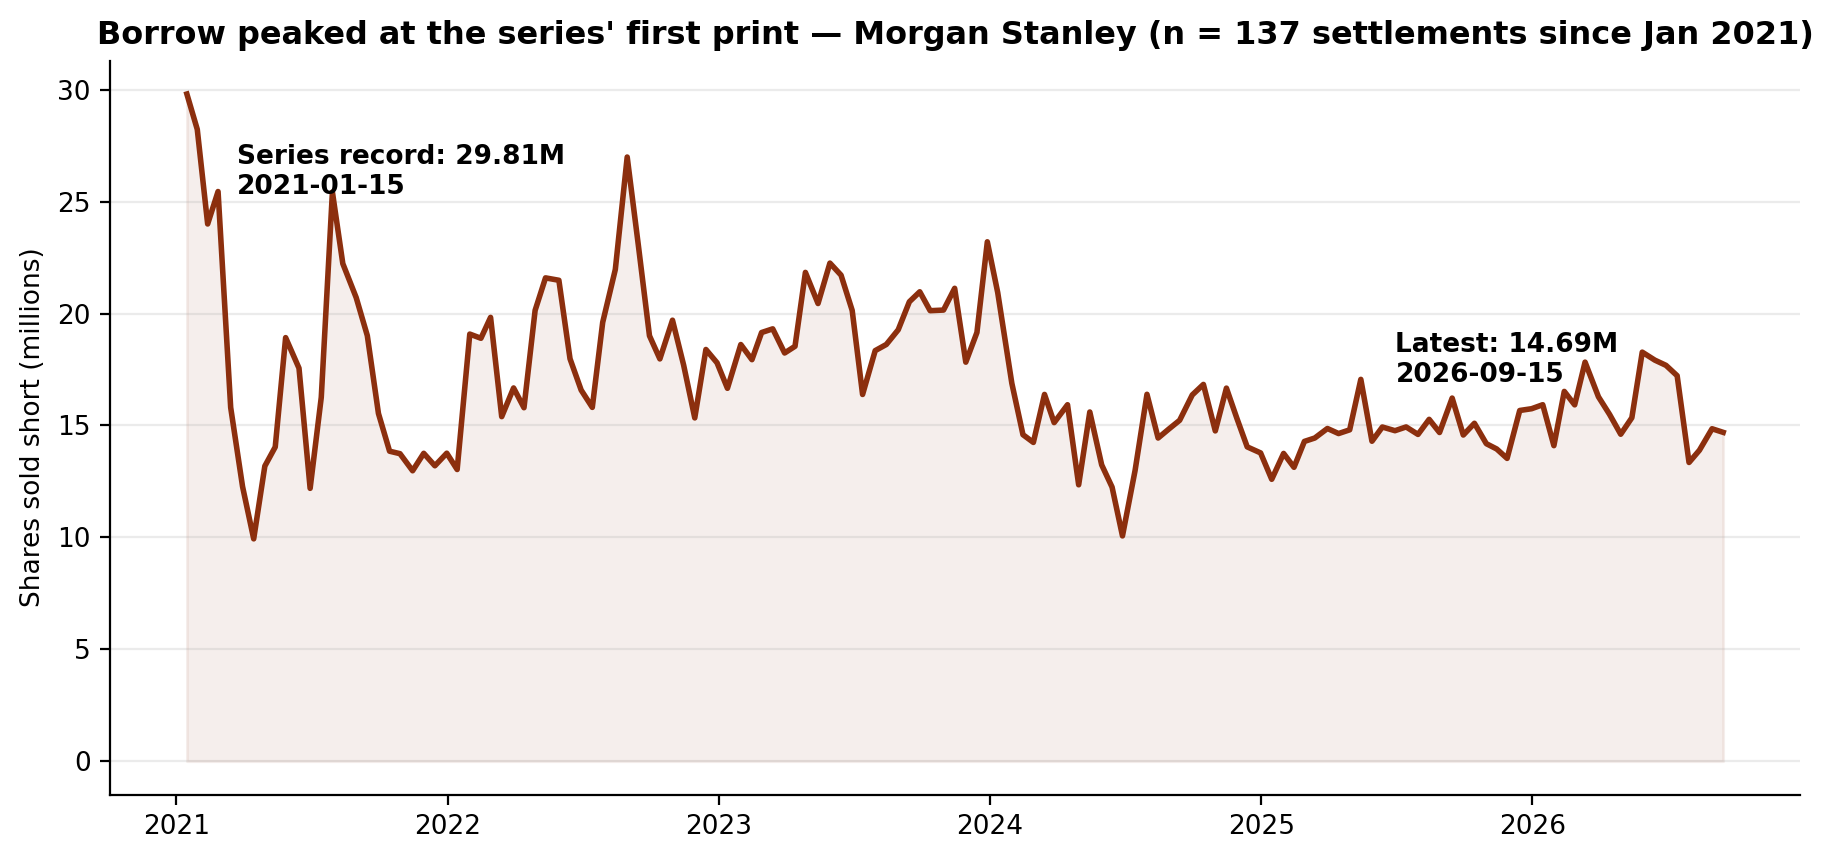
Lens 6 — short interest: 14,693,087 shares, under 1% of the count. As of September 15, 2026 — the most recent of 137 FINRA settlements since January 15, 2021 — 14,693,087 shares were sold short, down 1.09% from the prior settlement. The series maximum, 29,810,335 shares, sits at the series' first settlement, January 15, 2021 — verified by a maximum query over the whole series — and the latest sits 50.7% below it. The last five settlements read 17,224,493, 13,347,497, 13,893,636, 14,854,574 and 14,693,087. Against the year-ago 16,224,917 shares the latest is down 9.4%; against the June 30, 2026 settlement of 17,686,436 it is down 16.9%. Against 1,570,566,292 shares outstanding, it is 0.94% of the share count, at 3.23 days to cover.
The Gap
The narrative describes a bank that beat its quarter on the morning it reported — earnings per share of $3.03 against a $2.93 consensus, revenue up 12%, equities trading ahead of expectations. The filings describe positioning that was set before any of that was public. The full market held 1,340,316,406 reported shares at June 30, up 134,763,057 shares (+11.18%), as its filer count rose by 272 to 2,740. The tracked cohort held just 2,288,540 shares, and 70.9% of that arrived in a single quarter as Viking's new position, while the three continuing holders all decreased — one of them, Torray, by 92.3%. The 5% register is one strategic holder's amendment chain: MUFG at 24.12%, edging up by fractions across three prints. Insiders have never recorded an open-market purchase in the parsed record, and sold $8,881,800.42 in the last 90 days. Congress has exactly one recorded trade — a purchase. And the borrow, at 14,693,087 shares and 0.94% of the share count, is half its January 2021 level. One plausible reading is that the broad register and one new tracked position absorbed the second-quarter rise while the people inside the building only sold. The record supports each clause separately; it does not say which side the next quarter favours.
What Would Change the Picture
Nothing above is a recommendation. It is a record. These filings would change the description:
- 1. The 2026Q3 13Fs (filing window closing mid-November 2026). The cohort held 2,288,540 shares at June 30 — five holders, 70.9% in Viking's new position. Viking adding, trimming or exiting rewrites this lens on its own; a holder count moving off five does the same.
- 2. A first insider purchase of any size. The parsed record holds zero purchase transactions across 111 filings. One purchase breaks a pattern that currently has no exception.
- 3. A fourth MUFG amendment, or a fresh Vanguard print. MUFG's 24.12% dates to July 15, 2026 and Vanguard Capital Management's 5.65% to March 31, 2026. A step by either restarts this lens.
- 4. Whether the borrow rebuilds toward its July level, or fades further. Short interest stands at 14,693,087 shares, 50.7% below the series maximum of 29,810,335. A reading back above the July 15 print of 17,224,493 extends a rebuild; a reading below the series minimum of 9,934,030 sets a new series low.
- 5. A second recorded congressional trade. The combined record holds one purchase by one House member. A second trade — in either chamber, in either direction — gives this lens a second print to compare against.
Until one of those prints, the record describes a stock held by five of our 83 tracked superinvestors — 2,288,540 shares, seven-tenths of it one new position — whose insiders have never bought a share in the parsed record, whose largest registered holder reports 24.12%, and whose borrow sits below 1% of the share count.
As-of & Limits
The lenses rest on different clocks, none live: 13F is a June 30, 2026 snapshot published up to 45 days later; Form 4 runs through October 2, 2026; Congress through October 3, 2026 (Senate October 1); 13D/G through the July 15, 2026 filing; short interest through September 15, 2026; prices end October 2, 2026. Two limits are specific to this name: our fundamentals file's revenue field for this issuer carries an old fiscal-year label (see the fundamentals note below) and is not cited as a current figure anywhere in this audit; and this morning's earnings — the reason for the search interest — postdate every lens here, so nothing in the tape yet reflects positioning after the results.
Related reading: Ten of 83: One Holder Is 60.7% of the Superinvestors' CVS Health Stake. Its Insiders Filed Nothing in 90 Days. — Filing Tape #75; One of 83: Lone Pine Opened a New Nebius Position in Q2. Short Interest Is 18.49% of the Share Count. — Filing Tape #74; Two of 83: Viking Opened a New Take-Two Position in Q2. Its Insiders Have Never Bought a Share. — Filing Tape #73. Morgan Stanley's own page: Morgan Stanley (MS) on GetCoattail.
Methodology and data notes
- Superinvestor lens: 83 managers collected directly from SEC EDGAR Form 13F (managers_13f collection), positions as of June 30, 2026; Morgan Stanley identified by CUSIP 617446448. Five distinct managers hold long positions totalling 2,288,540 shares; there are no option rows for this name in the collection. The direction count on the collection's labels, across the long rows, is three DECREASED (Richard Pzena - Pzena Investment Management, David Katz - Matrix Asset Advisors, Torray Funds) and two NEW (Viking Global Investors, Mairs & Power Funds); the collection's exit list contains no Morgan Stanley row. Quarter-to-quarter cohort totals (745,257 long shares at March 31, in 3 rows; 2,288,540 long shares at June 30, a change of +1,543,283 shares or +207.08%) are from the site pipeline's holdings files on the same CUSIP basis in both quarters, and the pipeline's second-quarter totals match the EDGAR collection exactly on both shares and value (differences of 0 shares and $0). Viking Global Investors' share of the cohort is 70.9% = 1,622,593 / 2,288,540.
- Full-market lens: SEC Form 13F Data Sets full-market aggregation. The primary table is the full13f collection's by-ticker file (holders = distinct filers reporting the CUSIP; 2,727 reported long positions out of 2,740 filers). Morgan Stanley reports under a single CUSIP, 617446448, and the backfill fixtures' by-CUSIP row matches the by-ticker row exactly on holders, shares, reported value, prior holders and prior value. The by-ticker file's entered/exited fields (1,947 and 1,675, a net of +272 that matches the change in holder count) are gross flows, so this audit headlines the net change. Reported-value caution: the aggregate value ($277,082,025,837 over 1,340,316,406 shares) implies $206.73 per share against a June 30, 2026 close of $209.04 in our price file, a gap of -1.1% — printed here as found. The aggregate sums the VALUE of every information-table row — including put and call option rows — while the share count covers long common-stock rows only, so we headline filer and share counts and label dollar values "reported."
- Insider lens: full-parse Form 4 aggregation (agg_by_ticker), record as of October 2, 2026 (111 filings). Sale and purchase counts are transaction-code counts (S and P) in non-derivative rows; grants and exercises are not counted as purchases, and one filing can contain many transaction rows. Purchase transactions total zero in every window the aggregation publishes — the 90-day window (July 5 to October 2, 2026), the one-year window (October 3, 2025 to October 2, 2026) and the full parsed record — with zero buyers and zero officer purchases in each. Sale transactions total 5 in the last 90 days (40,719 shares, $8,881,800.42, 3 sellers, four of them officer sales), 34 in the last year (371,375 shares, $68,175,340.02, 9 sellers, 33 of them officer sales) and 54 across the parsed record (724,156 shares, $115,770,058.78, 11 sellers, 52 of them officer sales). The site's insider aggregate (compiled as of October 14, 2026, over a 90-day window) matches the full parse's 90-day window exactly on purchases (0), sales (5), sellers (3) and sale value ($8,881,800.42). The full-parse aggregate's sale-value totals imply $218.12 per share for the 90-day window, $183.58 for the one-year window and $159.87 for the full record, each inside the traded price range of its window on our price file ($188.01 to $228.55 for the 90-day window, $151.86 to $228.55 for the one-year window, and $70.40 to $228.55 across the price file), so the sale totals are cited as figures in this article. "Never bought" in this audit means no purchase transaction in the parsed Form 4 record we maintain; it is a statement about that record, not about any individual's complete history.
- 13D/G lens: full-parse SC 13D/G parsed filings (5 filings matching issuer CIK 895421 on CUSIP 617446448, 5 reporting-person rows across 3 names as filed: three SC 13D/A filings and two SC 13G-family filings — one SC 13G and one SC 13G/A — with four amendments in total), filings through July 15, 2026. The site aggregation carries this name under a ticker-keyed row; that row (5 filings, 3 D-filings, 2 G-filings, 4 amendments, 3 reporters, latest date July 15, 2026, maximum 24.12% and 1,230,684,885.0 reported shares) matches the parsed filings on filings, form mix, amendments, latest date, maximum and reported-share total. The parsed reporting-person rows sum to 1,230,684,885.0 shares, but that total sums reporting-person rows across different dates, so it is not used as a stake figure in the article. Mitsubishi UFJ Financial Group, Inc.'s chain (380,010,887 shares at 23.91% as of November 3, 2025, filed November 4, 2025; 380,307,520 shares at 23.95% as of April 13, 2026; 380,511,118 shares at 24.12% as of July 15, 2026 — all SC 13D/A), the Vanguard rows (The Vanguard Group printing 0 shares at 0.0% as of March 13, 2026, filed March 27, 2026 as SC 13G/A; Vanguard Capital Management printing 89,855,360 shares at 5.65% as of March 31, 2026, filed April 30, 2026 as SC 13G) are reported as filed, under the names exactly as they appear. The parsed coverage for this issuer holds these 5 filings; a 5% holder that has not filed in the covered window would not appear here.
- Congress lens: Senate PTR archive and House PTR archive as maintained on this site. The combined record (as of October 3, 2026) and the House aggregate (as of October 3, 2026) each carry one member, one purchase transaction, no sale transactions, a most recent purchase date of July 10, 2026 and a recorded party of R; the Senate aggregate (as of October 1, 2026) carries no row for this ticker. This audit reports the aggregates as they stand; it does not reconstruct individual filers beyond what the aggregates carry.
- Short interest lens: FINRA Equity Short Interest files (biweekly settlement dates), collected directly from FINRA's public distribution. The published series covers 137 settlements from January 15, 2021 (29,810,335 shares) to September 15, 2026. The latest reading is 14,693,087 shares on September 15, 2026, down 1.09% from the prior settlement (14,854,574 on August 31, 2026). The series maximum is 29,810,335 shares on January 15, 2021 — the first settlement in the series (verified by a maximum query over the series, not read off the latest row) — so the latest reading sits 50.7% below a maximum set at the series' start. The year-ago settlement (September 15, 2025) printed 16,224,917 shares, so the latest reading sits 9.4% below a year ago. The series minimum is 9,934,030 shares on April 15, 2021. The June 30, 2026 settlement printed 17,686,436 shares, so the latest reading sits 16.9% below the 13F snapshot date's borrow. FINRA publishes each settlement about two weeks after the fact, so the October price action is not yet in this series. The share-count ratio (0.94%) uses the fundamentals file's shares-outstanding figure below.
- Fundamentals note: our fundamentals collection carries Morgan Stanley's net income of $16,861,000,000 and assets of $1,420,270,000,000, each labelled fiscal 2025 in the file. The file is marked ok for this name, with no missing fields: shares outstanding of 1,570,566,292 (as of July 31, 2026 in the file, sourced in the file to the share count) and a file-computed market value of $300,009,579,808.02. The file does not flag the issuer as a foreign private issuer, and it carries SIC 6211, Security Brokers, Dealers & Flotation Companies. The file's revenue field for this name is $34,275,000,000 with a fiscal-year label of 2014 in the file — an old source value that this audit does not cite as a current revenue figure; it is recorded here only so the file's state is described honestly. The file's price for the name is $191.02 as of October 6, 2026; our daily-close file ends October 2, 2026 at $190.31, and we keep the two files' figures separate rather than blending them.
- Prices: our own daily-close file for Morgan Stanley through October 2, 2026 ($190.31 close, +7.2% year to date on that file; 252-session closing high $228.55 on July 15, 2026, so the last close sits 16.7% below it; 252-session closing low $151.86 on October 10, 2025, so the last close sits 25.3% above it; closes of $164.57 at March 31, 2026 and $209.04 at June 30, 2026, a second-quarter change of +27.0%; change from June 30 to October 2 of -9.0%; change from the September 30, 2025 close of $158.96 of +19.7%). The series in our price file begins June 1, 2021 at $92.11 and holds 1,342 rows.
- Market context sources: Google Trends United States list via a trends mirror ("morgan stanley" at 100+ searches, the only entry naming a listed company, with a CNBC earnings headline attached; list checked October 14, 2026); AltIndex meme-stocks list (checked October 14, 2026; its top names were already covered in this series, already set aside for missing lenses, or ranked below the Google list's stock entry — see the selection note in the data sheet); third-quarter 2026 results reported before the open on October 14, 2026 (GAAP earnings per share of $3.03 against a FactSet consensus of $2.93; revenue of $20.34 billion, up 12% year over year, against a $19.93 billion consensus; net income of $4.97 billion, up 7%), as carried by the Wall Street Journal and Seeking Alpha reporting, checked October 14, 2026; equities trading revenue exceeding expectations by $909 million, as carried by CNBC reporting attached to the trends listing, checked October 14, 2026. Figures we could not confirm against two sources were left out; the external items above are reported speech from those outlets, not GetCoattail measurements.
- Morgan Stanley is in the GetCoattail stock-page universe: Morgan Stanley (MS) stock page. Series data: ms_lens_data.csv · ms_short_interest_series.csv. Earlier audits: CVS Health · Nebius.
Past patterns are not a promise of future results. For education only — not investment advice.
This article describes public filings as of the dates stated. It is not investment advice and makes no recommendation. Filings lag reality: 13F positions are as of June 30, 2026, and later trading is not yet public.
Revision history
- v1.0 — October 14, 2026: first publication.